FTP captures one number but tells you nothing about how that threshold is composed. This article explains FTP's limitations and introduces metabolic profiling that reveals VO2max, VLamax, and substrate utilization from one test.
A Functional Threshold Power (FTP) test is easy to perform, you only need a power meter. However, the insights you get from knowing your FTP are also limited. In this article we share what science has to say about FTP. We also introduce a very similar test protocol that gives you a full view of your athlete performance – metabolic profile, instead of just one number.
Functional Threshold Power (FTP) is the highest power you can sustain for about 60 minutes. It’s a key metric used by cyclists, runners, and rowers to measure fitness. Functional Threshold Power or FTP essentially measures your threshold power in a functional context.
You can get to know your functional threshold power via a FTP test. A common way to test FTP is by performing a 20 minute all out effort.
You can calculate functional threshold power by multiplying your 20-minute power by 0.95. In other words: FTP is 95% of your 20 min power. Here’s the functional threshold power formula:
FTP = 20 minute average wattage * 0.95
A good functional threshold power depends on your gender, weight, age and should match with your desired fitness level. An FTP chart can give you a rough idea on whether your FTP is good or bad.
| MALE | <50 kg | 51-55 kg | 56-60 kg | 61-65 kg | 66-70 kg | 71-75 kg | 76-80 kg | 81-85 kg | 86-90 kg | 91-95 kg | 96-100 kg |
|---|---|---|---|---|---|---|---|---|---|---|---|
| World Class | 302 | 320 | 351 | 381 | 411 | 441 | 471 | 502 | 532 | 562 | 592 |
| Exceptional | 276 | 292 | 320 | 347 | 375 | 402 | 430 | 457 | 485 | 512 | 540 |
| Excellent | 249 | 264 | 289 | 314 | 338 | 363 | 388 | 413 | 438 | 463 | 488 |
| Very good | 220 | 233 | 255 | 277 | 299 | 321 | 343 | 365 | 387 | 409 | 431 |
| Good | 193 | 205 | 224 | 244 | 263 | 282 | 302 | 321 | 340 | 360 | 379 |
| Moderate | 164 | 174 | 191 | 207 | 224 | 240 | 256 | 273 | 289 | 306 | 322 |
| Fair | 138 | 146 | 160 | 173 | 187 | 201 | 215 | 229 | 242 | 256 | 270 |
| Untrained | 111 | 118 | 129 | 140 | 151 | 162 | 173 | 184 | 195 | 206 | 218 |
| FEMALE | 0-50 kg | 51-55 kg | 56-60 kg | 61-65 kg | 66-70 kg | 71-75 kg | 76-80 kg | 81-85 kg | 86-90 kg | 91-95 kg | 96-100 kg |
|---|---|---|---|---|---|---|---|---|---|---|---|
| World Class | 268 | 284 | 311 | 338 | 365 | 391 | 418 | 445 | 472 | 499 | 525 |
| Exceptional | 243 | 258 | 282 | 307 | 331 | 355 | 380 | 404 | 428 | 453 | 477 |
| Excellent | 219 | 232 | 254 | 276 | 298 | 319 | 341 | 363 | 385 | 407 | 429 |
| Very good | 192 | 204 | 223 | 242 | 261 | 280 | 300 | 319 | 338 | 357 | 377 |
| Good | 167 | 177 | 194 | 211 | 228 | 244 | 261 | 278 | 295 | 311 | 328 |
| Moderate | 141 | 149 | 163 | 177 | 191 | 206 | 220 | 234 | 248 | 262 | 276 |
| Fair | 116 | 123 | 135 | 146 | 158 | 170 | 181 | 193 | 204 | 216 | 228 |
| Untrained | 92 | 97 | 106 | 115 | 124 | 134 | 143 | 152 | 161 | 170 | 179 |
Before you start to interpret your FTP test results, it’s important to understand the origin of FTP. This enables you to see FTP for what it is, and what it isn’t.
Let’s have a look at what science tells us about interpreting FTP test results.
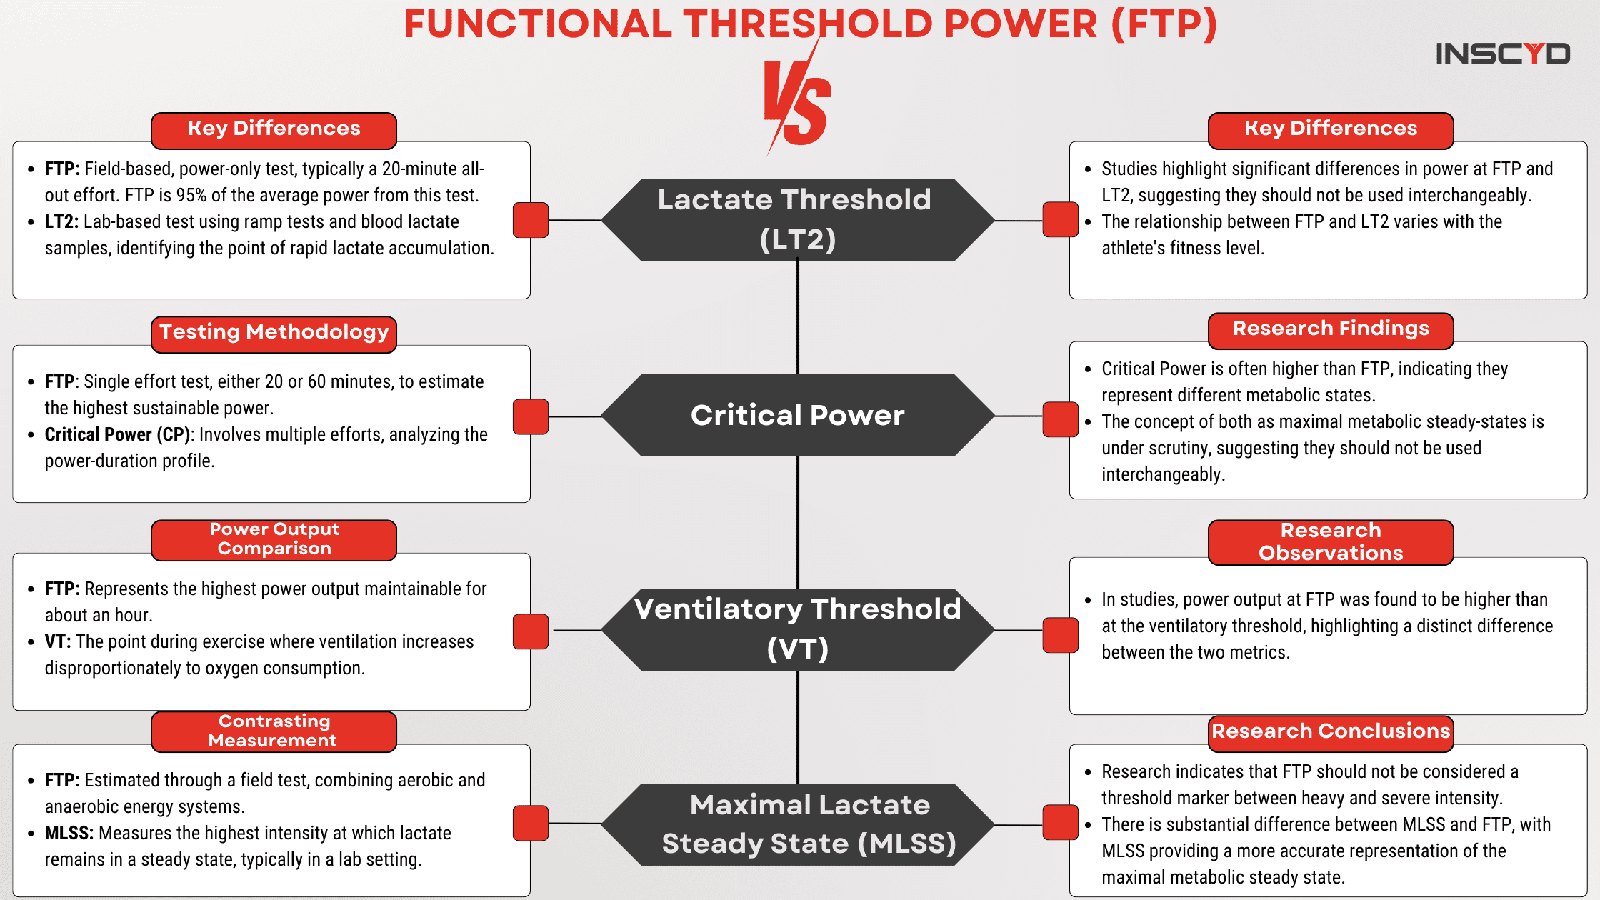
As you’ve learned in the video, functional threshold and lactate threshold (or anaerobic threshold) are not the same. While both FTP and lactate threshold try to describe the highest intensity at which lactate does not accumulate, the difference is in the way you measure it.
FTP is measured in a power-only test, while the lactate threshold test is often a ramp test in the lab, using blood lactate samples. As a result the anaerobic lactate threshold (also known as LT2) is not exactly the same as FTP.
Functional Threshold Power as an Alternative to Lactate Thresholds in Road Cycling (2022)
Functional Threshold Power Is Not Equivalent to Lactate Parameters in Trained Cyclists (2021)
Is the Functional Threshold Power a Valid Surrogate of the Lactate Threshold? (2018)
Functional Threshold Power in Cyclists: Validity of the Concept and Physiological Responses (2018)
The same is true when comparing FTP with Critical Power. Although FTP and Critical power might both aim to find the intensity that you can maintain for a long amount of time, the exact definition and test differs.
The most straightforward difference is that FTP is measured in a single 20 or 60 minute effort, while Critical Power takes multiple efforts on the power-duration profile into account. Learn more about Critical Power (CP), power-duration curves and the physiology behind critical power in our webinar.
Do Critical and Functional Threshold Powers Equate in Highly-Trained Athletes? (2021)
Relationship Between the Critical Power Test and a 20-min Functional Threshold Power Test in Cycling (2021)
What if you compare Functional Threshold Power with the ventilatory threshold, also known as VT or VT2? By now you start to see the pattern. In a study with 46 cyclists, FTP power turned out to be significantly higher than power at the ventilatory threshold.
Last but not least, as the video shows, Functional Threshold Power and Maximal Lactate Steady State are not the same. Again, they may both try to describe the highest intensity at which lactate does not accumulate, the difference is in the way you measure it. In fact, MLSS is the only test that actually measures the highest intensity at which lactate remains in steady state.
Functional threshold power is not a valid marker of the maximal metabolic steady state (2022)
GCN: “There’s not a strong physiological basis to your FTP.”
FTP is the highest power that you can sustain for about 60 minutes, which is often measured by taking 95% of a 20 minute FTP test. That’s what it is: the highest average power in a test.
The test result itself doesn’t tell you anything about how your FTP power is composed. In fact, FTP is a combination of aerobic and anaerobic power. So it’s not 100% aerobic nor 100% anaerobic.
GCN: “You can produce your FTP in different physiological ways. It doesn’t tell you anything about race winning moves”
One athlete may have a 90% aerobic and 10% anaerobic energy contribution, while another athlete may have a totally different mix. Moreover, an athlete can have a certain combination of aerobic and anaerobic energy contribution on day 1, and a different one on day 2.
Learn more about the contribution of aerobic and anaerobic energy systems on your FTP in this video:
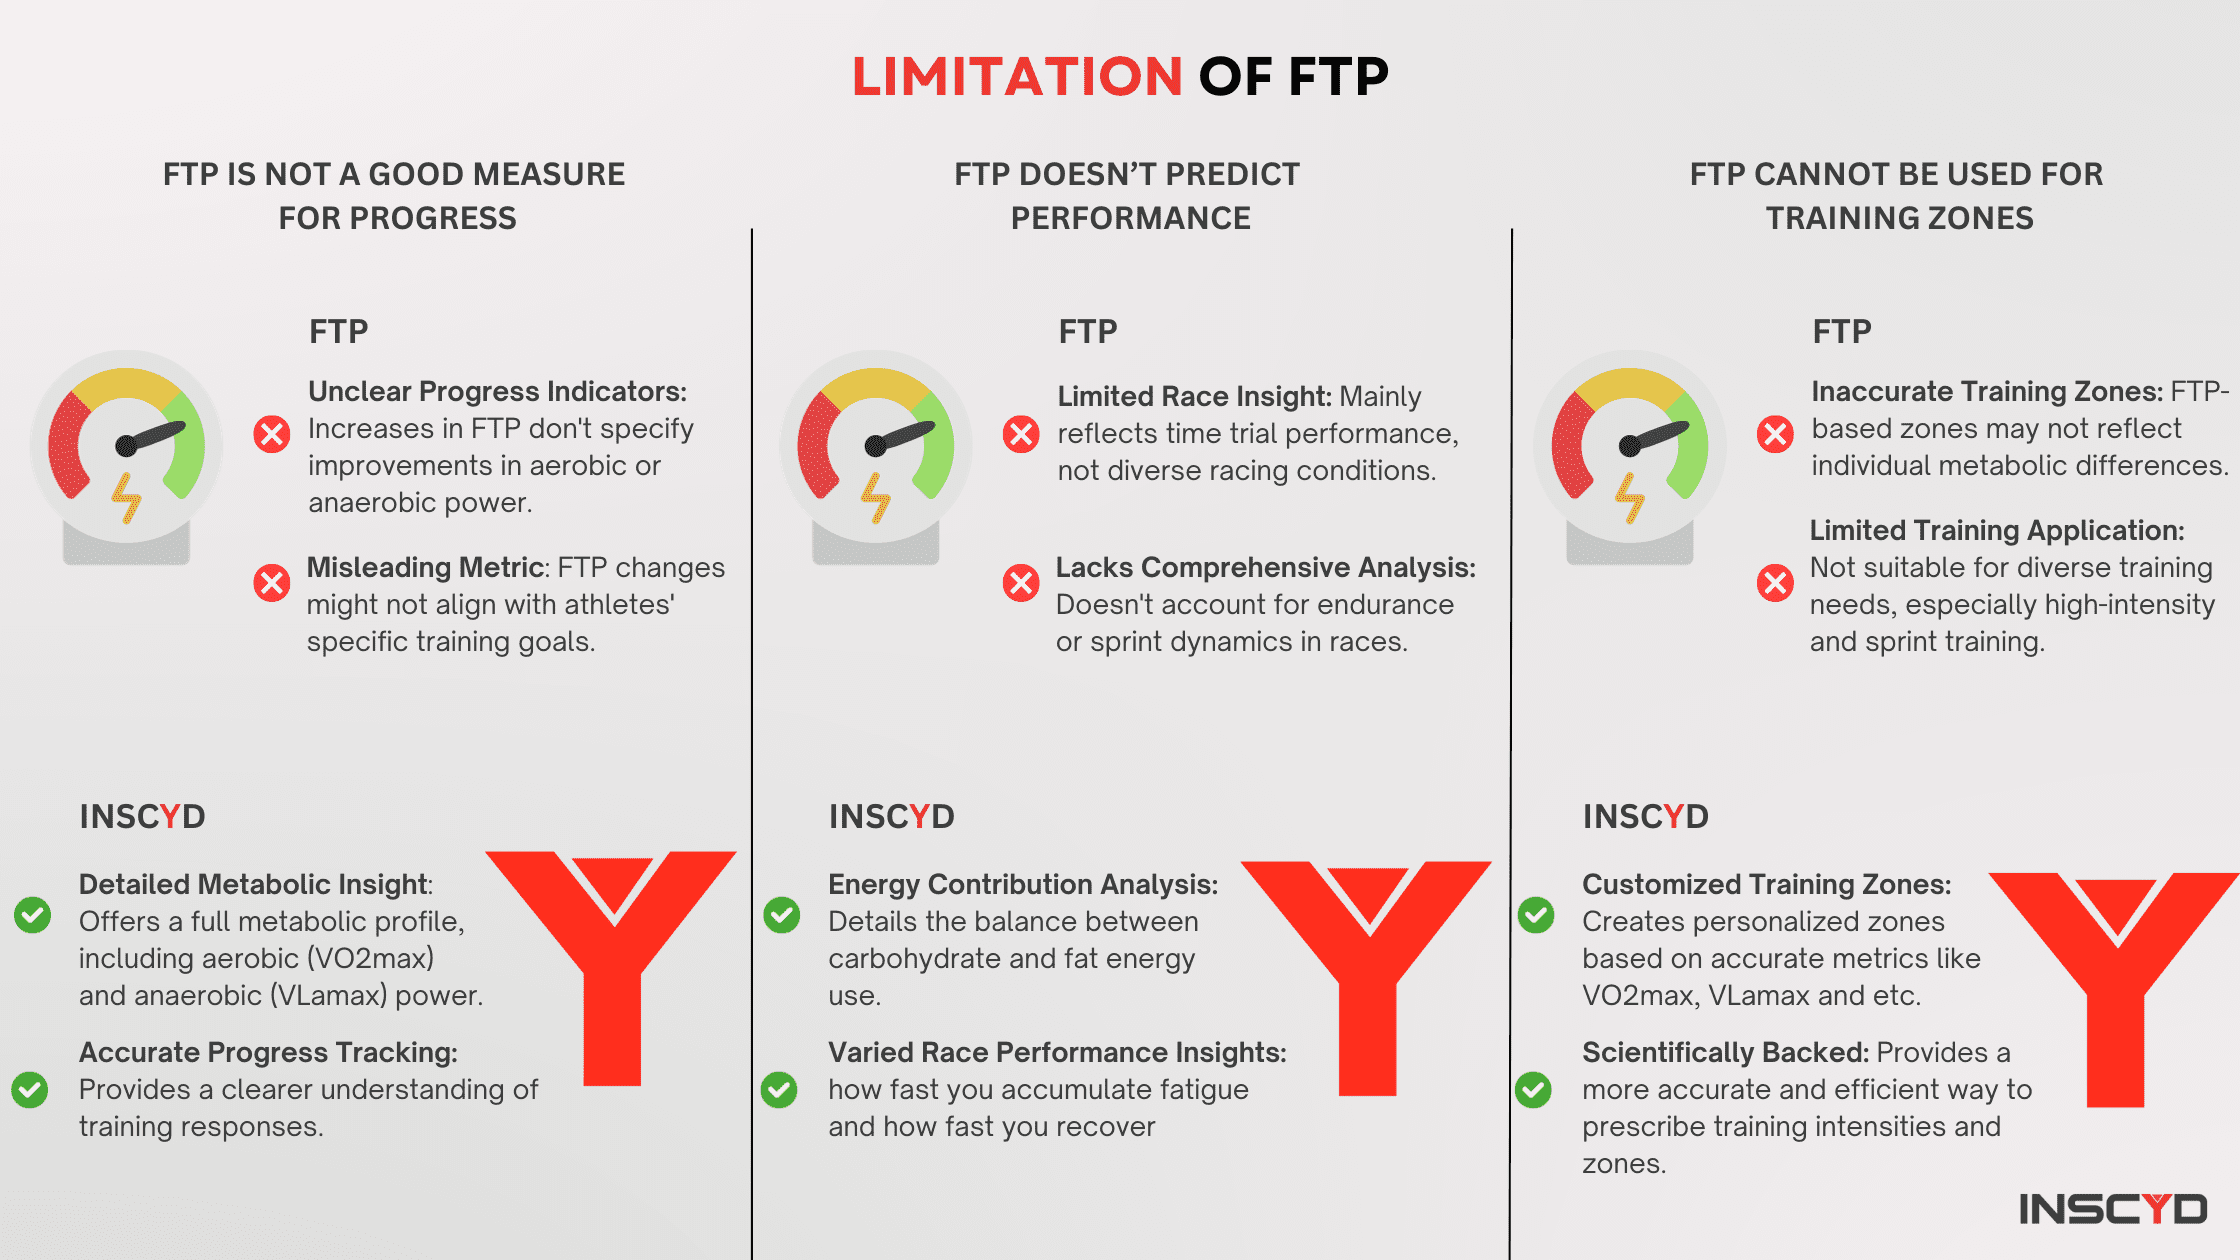
That brings us to the limitations and possible alternatives. Here are the 3 biggest limitations of FTP, with an easy to perform alternative.
When FTP increases, you can’t say you increased aerobic- or anaerobic power. You simply don’t know.
In fact, an increase in FTP could be a combination of a decrease in anaerobic power and an increase in aerobic power.
Moreover, for many athletes, increasing FTP might not be the goal to pursue anyway.
If you want to track progress, you need to know how the body responds to training in more detail. For instance by looking at changes in aerobic power (VO2max) and anaerobic power (VLamax).
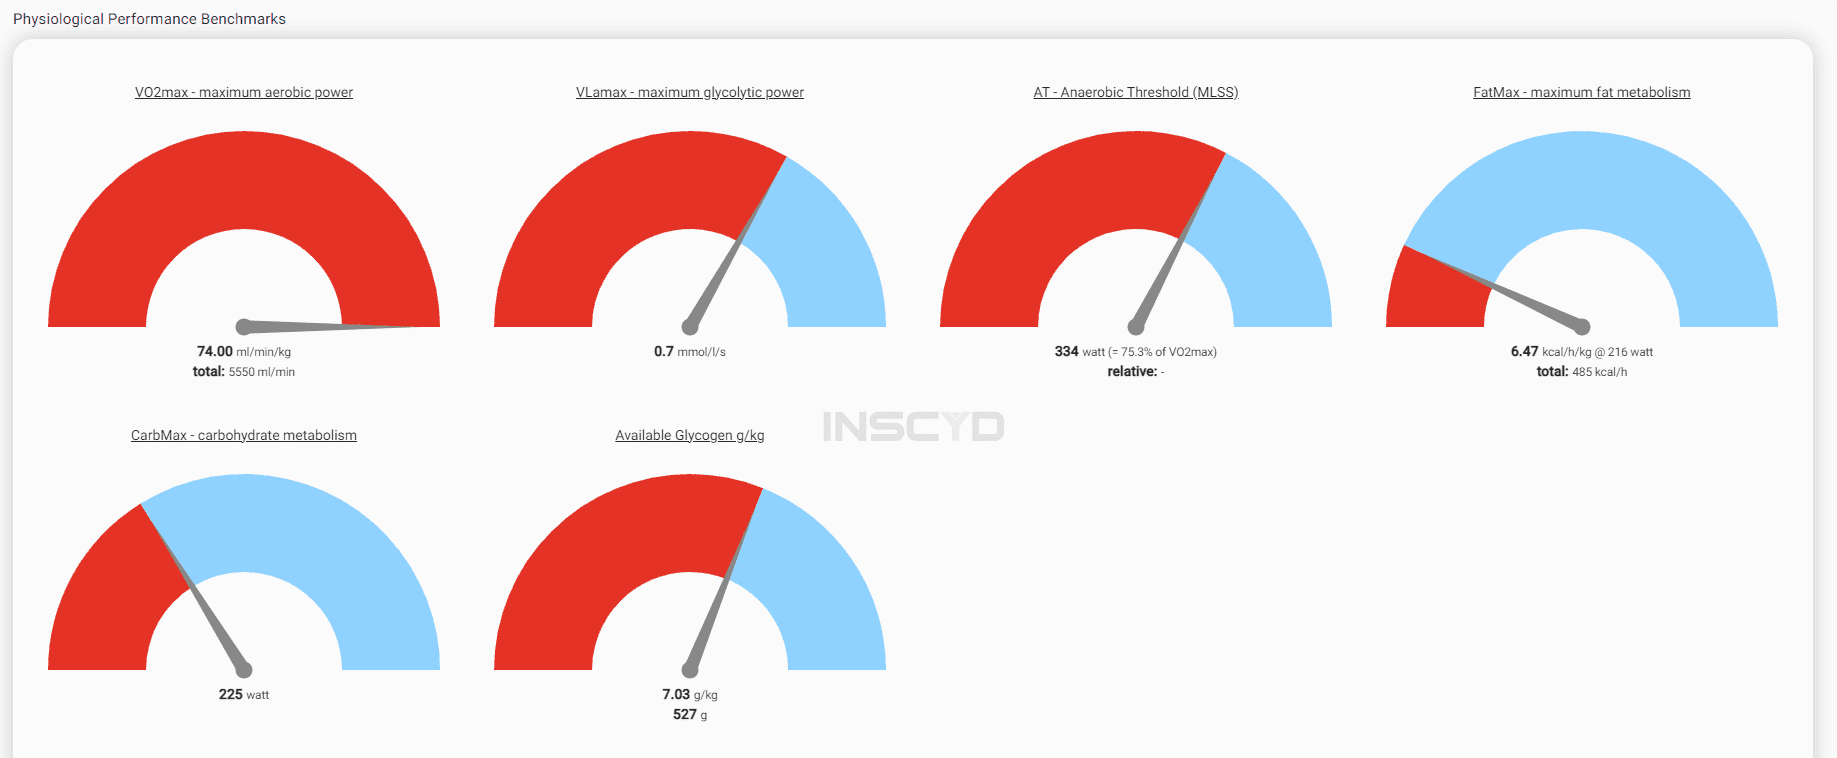
The INSCYD Power-Performance Decoder test is a perfect alternative for the FTP test, since it also only requires a power meter (cycling) or GPS watch (running). However, instead of giving you one single FTP metric, you get a full 360 metabolic profile. Continue reading to learn more about the test and test results.
Download PPD cycling protocolDownload PPD running protoco
FTP tells you something about your 20 minute (or 60 minute) time trial performance. However, most races are much longer and/or won after an attack or sprint.
If your races are longer, then your performance highly depends on the carbohydrate vs fat energy contribution. If two athletes have the same FTP, but one is able to produce the power with a higher energy contribution from fat, then this athlete has a big advantage over the other athlete in endurance events.
The INSCYD Power-Performance Decoder test shows exactly what the energy contribution is at any given exercise intensity:
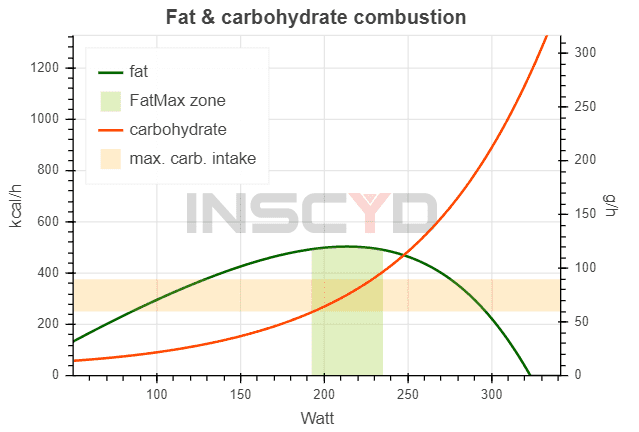
Learn more about fat combustion and carbohydrate combustion.
If your races include accelerations like attacks and sprints that far exceed the FTP intensity, then you should look at how long you can maintain a certain intensity above FTP. It’s equally important to know how well you’re able to recover fast from an attack.
Contrary to the FTP test, the INSCYD Power-Performance Decoder test shows both these functions. The good part: you only need to perform 4 all-out efforts, using a power meter (cycling) or GPS watch (running).

Learn more about the lactate recovery and accumulation graph in our free whitepaper:
Unlock the science of lactate accumulation. Interested in understanding the intricacies of lactate accumulation and how it affects athletic performance? Our comprehensive whitepaper offers valuable insights backed by scientific research.
FTP is not the most efficient and precise way to prescribe training intensities and training zones. For instance, the fat and carbohydrate combustion rate can vastly differ between athletes at 60% of FTP. The same is true for aerobic vs anaerobic energy contribution, lactate concentrations, etc. As a result, it’s not very accurate to do endurance training based on %FTP.
We created a full webinar about why you should or shouldn’t base training zones on FTP. It’s full of practical examples and easy to implement alternatives. Watch the recording for free:
The limitations of FTP are also very obvious when applying it to high intensity training and sprint training. Athletes that have a high FTP don’t necessarily produce high power values at short explosive intervals. Creating such workouts based on FTP would not make sense.
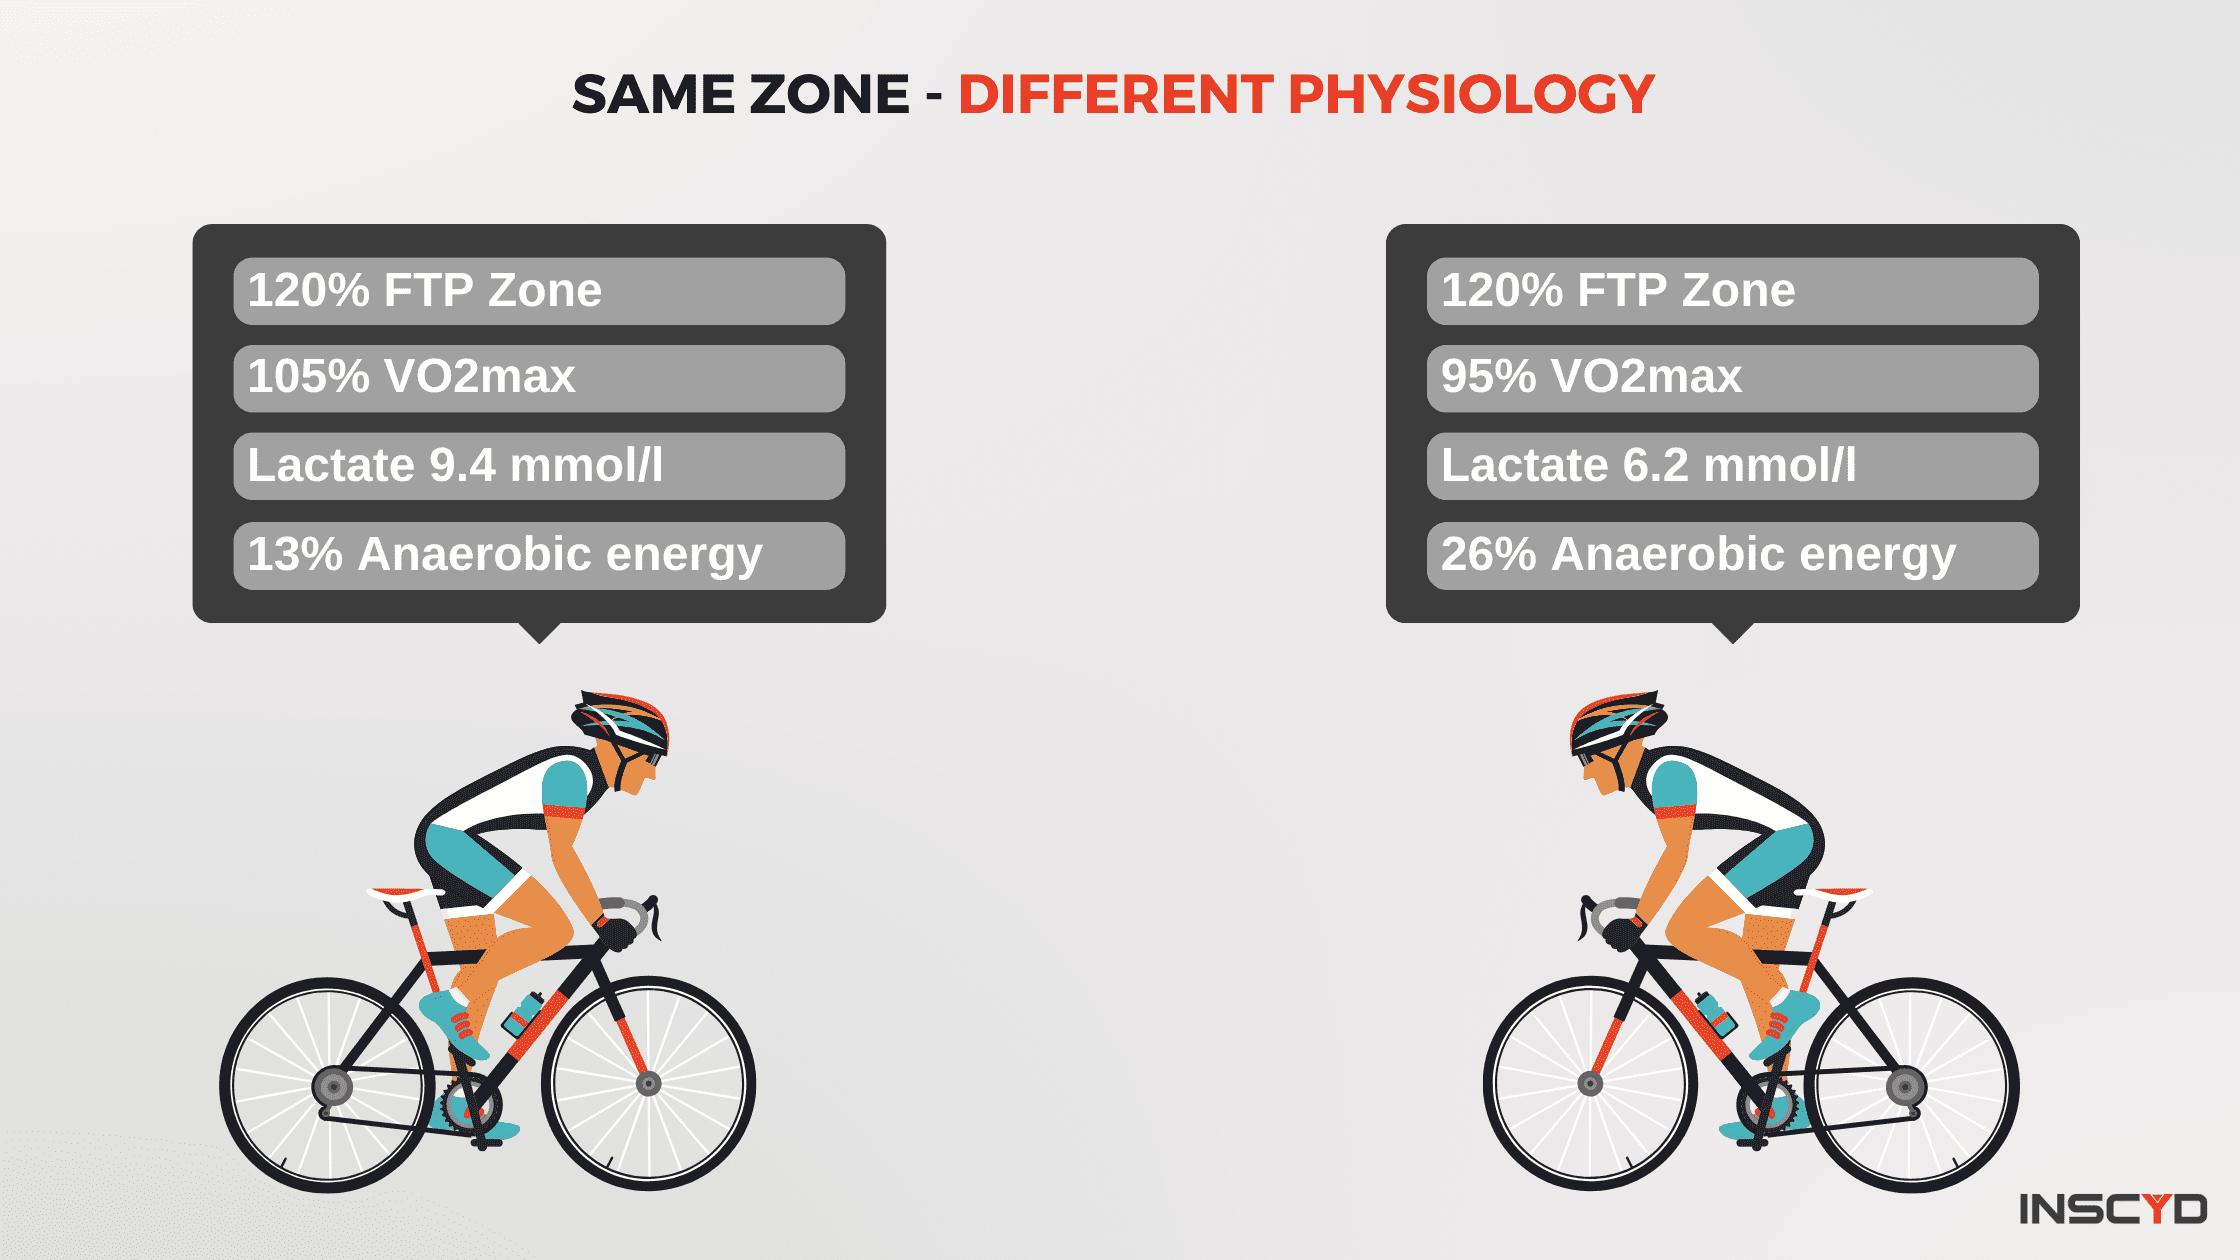
More importantly: why use an FTP test for training zones when there is a better alternative that is as easy to test? The INSCYD Power-Performance Decoder test gives you the opportunity to create training zones on the metric that matters. For instance:
If you like the convenience of FTP testing, but want more details about athlete performance, the INSCYD Power-Performance Decoder (PPD) is your solution.
“The INSCYD PPD test gives you a good insight on how you can manage the training”
“Using INSCYD PPD, I could clearly see his strengths (and limiters) and realised he needed to train and perform differently to maximise his natural ability.”

“PPD test results were shockingly accurate and the test was easy to perform. It’s “user friendly” because you can separate the test into multiple days. Even more important: from a result perspective, you get more out of it than with a traditional (lab)test.”

“the PPD test is even easier because we don’t have to take the lactate. So the coach doesn’t have to be there.”

Similar to the FTP test, it only requires a power meter (cycling) or GPS watch (running). You can do the PPD test on Zwift, just like the Zwift Academy team does on the GCN YouTube channel:
Perform 4 all out efforts and get a full metabolic profile, with performance metrics like:
| Parameter | INSCYD PPD Test | FTP Test |
|---|---|---|
| Equipment | Power meter or GPS watch | Power meter |
| Protocol, all out-efforts | 20sec, 3min, 6min, 20min | 20-60min |
| Training Zones | Based on metabolic parameter | Based on FTP |
| Anaerobic Threshold | MLSS | FTP |
| VO2max (maximum aerobic power) | ✓ | ✕ |
| VLamax (maximum anaerobic power) | ✓ | ✕ |
| FatMax (intensity at which the most fat is burned) | ✓ | ✕ |
| Fat and carbohydrate utilization at any intensity (kcal/h and g/h) | ✓ | ✕ |
| Lactate accumulation rate at high intensities | ✓ | ✕ |
| Lactate recovery rate at low intensities | ✓ | ✕ |
| Scientifically validated | ✓ | ✕ |
The PPD is as accurate as a lab test, according to an undercover test and scientific publications:
“Correlations between power output at the MLSS derived from laboratory and INSCYD athletic performance software was very strong.”
“No significant differences were found between laboratory and INSCYD athletic performance software derived V̇O2max values for absolute and relative.”
Stop relying on FTP testing only and integrate the latest sport science and data-driven training approach. INSCYD is here to help you avoid falling behind.
As a coach or lab professional, you now understand the limitations of traditional metrics like FTP in revealing the full athletic potential. INSCYD’s Power-Performance Decoder offers a groundbreaking alternative, providing a comprehensive metabolic profile that goes beyond just numbers.
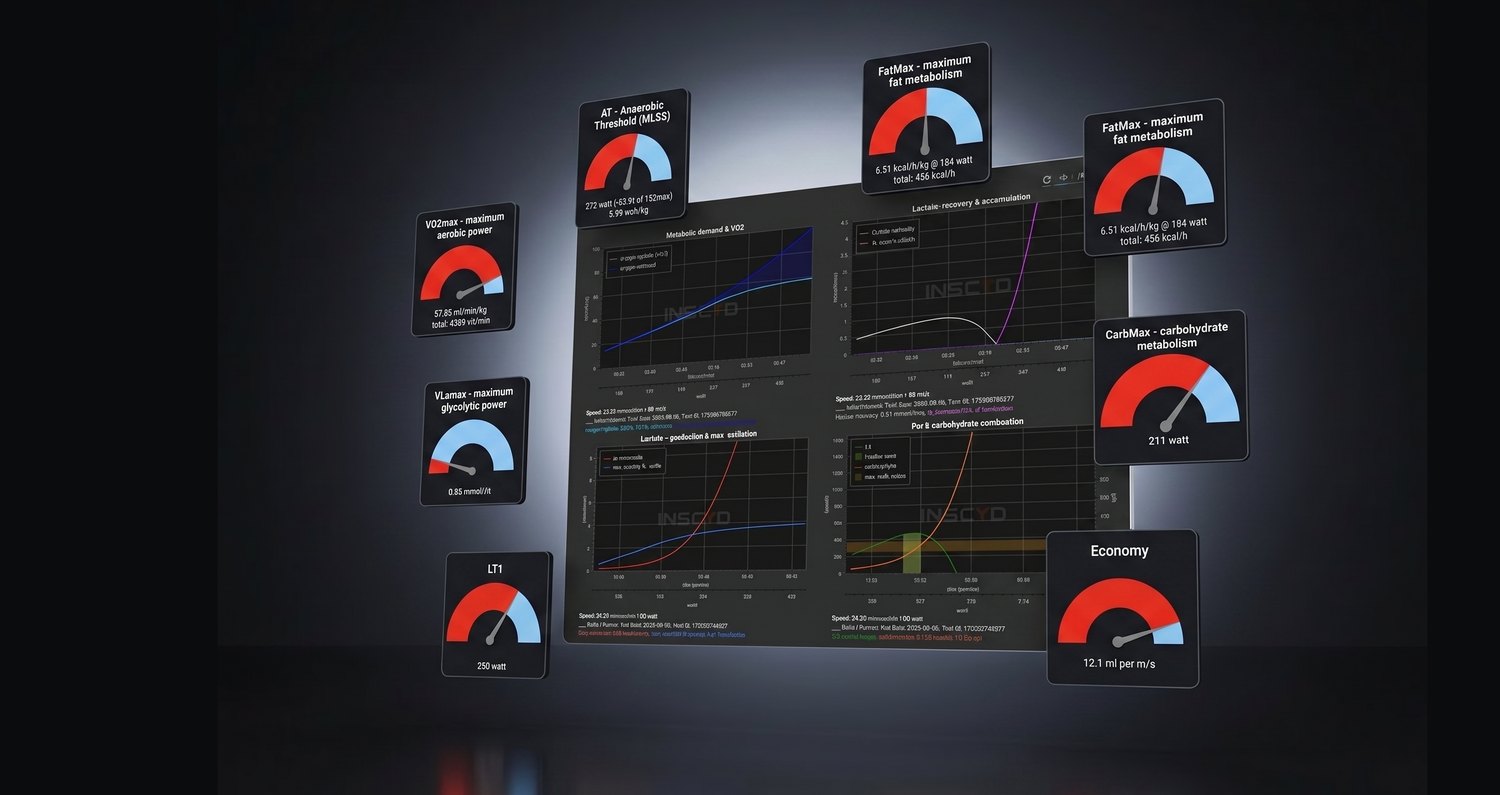
VO₂max, VLamax, FatMax, thresholds, fuel use and training zones, from a single test in the lab, in the field or fully remote.

