

Article
[Ultimate Guide] Zone 3 Training: Sweet Spot or Grey Zone?
Some refer to zone 3 training as sweet spot training while others call it the grey zone. This article reveals what zone 3 training is
For:
Many labs and coaches use lactate threshold graphs to measure progress in their athletes. However, when analyzing a lactate threshold chart, it’s important to know exactly which factors cause a shift in the lactate curve. After reading this article, you will understand why a right shift in the lactate curve can be a bad thing. You will also learn a practical way to look at aerobic and anaerobic power separately, instead of combining them into one single lactate threshold graph. Let’s get started!

Spread the knowledge! Share this article with your fellow coaches and athletes. Click the share buttons below and inspire others on their journey to athletic excellence.
A lactate threshold test is an exercise test in which you increase the intensity step by step. By measuring blood lactate after every step, during the (sub) maximal incremental test, you get a lactate curve. This curve is plotted in a graph that has intensity such as power or speed on the x-axis and blood lactate concentration on the y-axis.
The lactate curve can be derived from a step test with or without recovery in between steps.
Here’s an example of a lactate profile, derived from a conventional lactate threshold test.

If you’re interested in diving deeper into the practical aspects of lactate testing, don’t miss this comprehensive e-learning course – How To Take Blood Samples For Lactate Testing. It covers everything you need to know about taking blood samples for accurate results.

The lactate curve shows the lactate concentration of an athlete, depending on exercise intensity. When exercise intensity increases, blood lactate concentrations increase. It’s important to know why this happens.
The blood lactate concentration that you measure mainly depends on three factors:
The lactate threshold graph shows that when intensity increases, lactate production increases more than lactate combustion. As a result, lactate concentration increases.
In our exploration of lactate curves, it’s essential to understand the role of the first lactate threshold, or LT1. As explained in our guide about – Lactate Threshold 1 (LT1), ‘LT1 is the lowest exercise intensity at which there is a measurable increase in blood lactate concentration, compared to resting lactate concentrations.’
This threshold is a significant marker in endurance training and plays a vital role in how the lactate curve is formed and interpreted. Dive into the details in our comprehensive guide about LT1.
Lactate threshold tests are often used to determine progress, by comparing a lactate profile before vs after a training program.
Many coaches believe a right shift of the lactate curve means their athlete’s aerobic performance increased and consider this as a good thing. However, a right shift is not necessarily caused by an increase in aerobic performance, which we will explain in more detail shortly.
Since so many factors determine a lactate profile, you can have two similar lactate curves from two entirely different athletes, from a metabolic profile perspective.
The opposite is of course also true: two athletes with the same VO2max can have very different lactate profiles:

Another important aspect to consider when analyzing lactate threshold curves is the concept of the anaerobic threshold. Many performance labs and coaches determine the anaerobic threshold based on a lactate concentration of 4 mmol/l during an incremental test.
However, is this a valid method of assessing the anaerobic threshold? Our article – “Does The Anaerobic Threshold Really Occur At 4 Mmol/l Blood Lactate?” explores this question in depth, discussing the origins of the 4 mmol/l theory, why it may not necessarily equal MLSS, and the importance of the original test protocol. Understanding these nuances can provide a more accurate picture of an athlete’s performance and potential.
In addition to understanding these thresholds, it’s equally important to grasp how lactate accumulation and recovery can shape your training program. Our white paper provides a detailed exploration of lactate dynamics and their role in optimizing athletic performance. Download it now
When the lactate curve shifts to the right, you have a lower lactate concentration for the same exercise intensity. You could also say the lactate curve moved downwards.

A right shift of the lactate curve is often associated with an increase in (aerobic) performance. But this is not necessarily true.
First of all, it could be caused by many factors. For example:
Secondly, it could be a combination of changes in the above factors. For example: both the anaerobic power and the amount of body fat decreased, which both caused a shift to the right. Or to make things more complicated, it could also be a mixture of good (increase in aerobic power) and bad (decrease in economy) changes. But because one effect is stronger than the other, the net result is a shift to the right.
As long as you don’t know which of these parameters changed, it’s hard to tell whether a right shift of the lactate curve is a performance improvement. INSCYD performance software allows you to look at these metrics separately. This enables you to connect a specific training program to the exact result of that program. You now finally know what works for your athlete, and what doesn’t. This gives you unique insights that help create future training plans.
If you’re a coach or a lab seeking to leverage the power of lactate threshold graphs and build effective, precision-focused training programs, don’t miss out on this opportunity. Our INSCYD experts are on hand to provide insights and guidance that can help you optimize your training programs, unlocking the true potential of your athletes. Book your free consultation call today. Additionally, athletes can connect with an INSCYD certified coach or lab.
Thirdly, even if you do know which metrics changed, it still depends on your goal whether that is an improvement or not. A cyclist who has a right shift of the lactate curve because the anaerobic power decreased, while the aerobic power remained the same, can get in trouble during race decisive moments. However, a marathon runner who had an unnecessarily high anaerobic power may consider the exact same shift as an improvement.
In summary: whether a shift to the right of the lactate curve is a good thing depends on what exactly caused the shift and your goal. Here’s how INSCYD can help you in better understanding your lactate threshold cures.
When the lactate curve shifts to the left, you have a higher lactate concentration for the same exercise intensity. You could also say the lactate curve moved upwards.

A left shift of the lactate curve is often associated with detraining or a decrease in (aerobic) performance. But this is not necessarily true. In fact, a left shift of the lactate curve could be caused by an increase in anaerobic (sprint) power, while VO2max stayed the same.
This could be exactly what you need to win more races. After all, many “endurance” races are won during high-intensity decisive moments.
The factors that cause a leftward shift of the lactate curve are the opposite of the factors that cause a rightward shift. It’s again crucial to know exactly which factor(s) changed to know whether your performance is improving or not.
When the lactate curve remains the same between test and retest, you could easily jump to conclusions. However, consider this possibility:
By now you know the importance of knowing exactly which metrics caused a (lack of) change in the lactate threshold curve. Let’s finish this article with how you can look at these metrics separately.
Lactate curves are often used to understand your current performance or to track performance over time. We’ve seen that in both cases, the lactate threshold curve itself is not sufficient to draw conclusions. But there’s a solution.
You can use a very similar step test protocol (with recovery between steps) and look at aerobic power (VO2max) and anaerobic power (VLamax) separately.
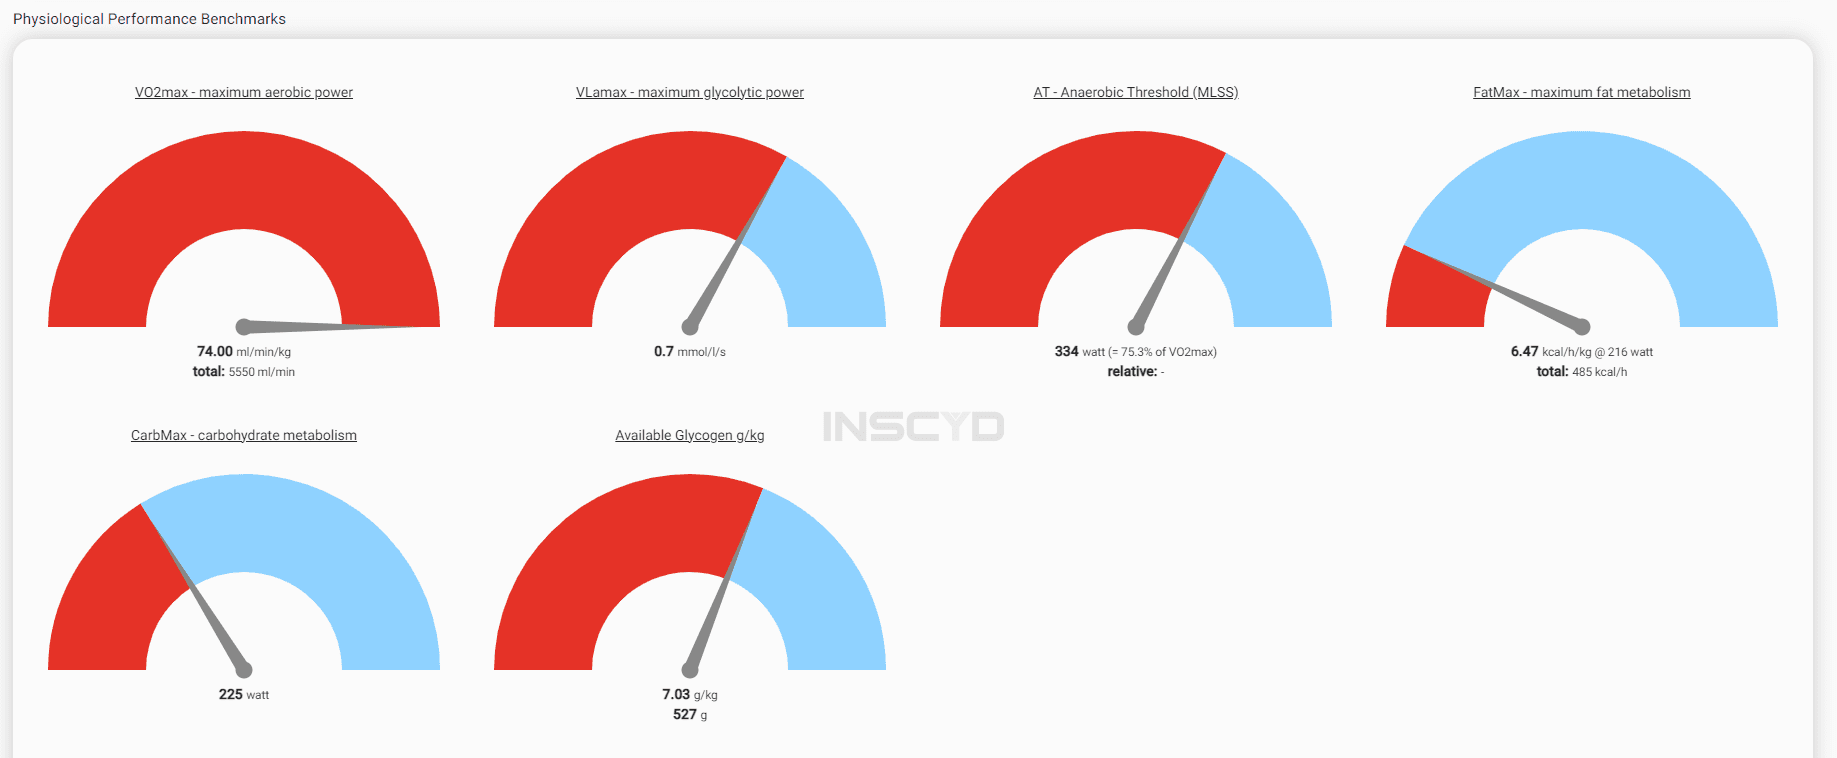
Simply plug the results in the INSCYD performance software. INSCYD looks at the lactate dynamics (Lactate concentration x Interval time x Interval intensity). By doing so, it enables you to understand changes in individual processes, instead of combining it all into one curve. It also takes changes in body composition and economy into account.
This allows sport coaches and labs to truly see what the effect of a training program is, so you can adapt accordingly. If you’re a coach or a lab don’t wait – seize this opportunity to enhance your coaching methodologies and elevate your athletic performance. Book a free consultation call with our INSCYD experts today. And athletes can perform an INSCYD test with one of our partner labs or coaches.
Want to learn more about interpreting lactate curves? Here are two case studies that show how important it is to look beyond the lactate threshold graph:
Your understanding of lactate curves is now more nuanced and detailed. You’ve seen the importance of looking beyond the curve itself, recognizing the multitude of factors that can influence it. Yet, understanding this complexity is just the first step. Taking action and applying these insights into your coaching or training practices is where real change happens.
If you’re a coach or a lab seeking to deepen your expertise, we invite you to seize this opportunity. Partner with our INSCYD experts, who are ready to guide you in optimizing your training programs, enhancing your methodologies, and unlocking the true potential of your athletes. Book your free consultation call now.
And for athletes striving to reach their peak performance, connect with an INSCYD certified coach or lab. Harness the power of precision-focused training informed by in-depth lactate curve analysis. Find your INSCYD coach or lab here

Some refer to zone 3 training as sweet spot training while others call it the grey zone. This article reveals what zone 3 training is

In the quest for Olympic glory, USA Triathlon’s Project Podium has partnered with INSCYD, a leader in exercise physiology analytics, to revolutionize the training of

So you received your metabolic test report and now wonder what you should work on to improve performance? Here’s how to discover potential room for

Zone 4 training, also known as threshold training, is used by the world’s best triathletes and marathon runners. But the true training effect of zone

A Functional Threshold Power (FTP) test is easy to perform, you only need a power meter. However, the insights you get from knowing your FTP

Whether a VO2max of 50 is good depends on your age and gender. Moreover, while average VO2max values tell you something about your health, athletes

Create highly personalized training programs with lab-level performance insights anywhere anytime to analyze, optimize and improve performance faster and save cost