


TrainingPeaks vs INSCYD
This article talks about the differences between a training platform like TrainingPeaks and INSCYD performance software. We also show how teams like Alpecin-Deceuninck combine both tools to prepare their pro athletes for key races. *Although we compare INSCYD with TrainingPeaks, the same is true for other training platforms like Today’s Plan, AZUM, etc. Prefer watching…

How to start using INSCYD
Whether you are an athlete, a coach, a national federation or a lab: starting to use INSCYD is easy and affordable. In this blog we briefly sum up what is necessary to join INSCYD. You are an athlete? Read how you can schedule your first INSCYD test! You are a coach or lab? Read what…

Mastering Nutrition Utilizing INSCYD
In this blog, Certified Sports Nutritionist Coach Sofi Marin (INSCYD user since 2017) explains how she translates INSCYD data into specific nutrition advice. After all, who knows better how to use INSCYD than an INSCYD user? Translating INSCYD insights into specific nutrition advice With INSCYD, I have clear and specific data to support and justify…

Digitalisierung der Leistungsdiagnostik
Leistungsdiagnostik 4.0 Wir wollen in allen Bereichen des Trainings auf dem neuesten Stand der Technik sein. Wenn es aber um die Ausdauerleistung geht arbeiten die meisten Trainer mit herkömmlichen Laktatstufentests. Einer mehr als 30 Jahre alten Methodik. Wie passt das zusammen? Dabei ist der Fortschritt längst in der Ausdauerdiagnostik angekommen. Leistungsdiagnostik findet heute da statt…

INSCYD Performance Projection: predict future performances (and boost your business)
With an INSCYD performance projection, you can show your athletes exactly how much their FTP (or any other parameter) changes when they increase their VO2max (or any other parameter) by say 5%. In our experience, that is exactly what motivates athletes to stick to a training program and retest more frequently. The performance projection (dashed…

How Time-Crunched Amateur Athletes Benefit from INSCYD
In collaboration with renowned coach Frank Pike, we share why and how recreational athletes and age groupers benefit from using INSCYD. Spread the knowledge! Share this article with your fellow coaches and athletes. Click the share buttons below and inspire others on their journey to athletic excellence. Facebook Twitter LinkedIn Reddit Email The challenge of…

Individualize race preparation based on athlete’s unique metabolic profile
The last weeks prior to an important race event are crucial. Use the wrong training strategy, and all the hard work is lost. Manage your training the right way and you’ll boost your performance by a few percent. In this use case, Benjamin Tilus, National Champion Coach and Founder of XLR8 Performance Lab, shares how to…

3 Key Metrics Athletes Want to Know: How to Collect and Use Them
As a sports performance coach, you’re well-versed in creating training plans and guiding your athletes to success. However, are you providing them with the metrics they truly crave? Our survey revealed that athletes are highly interested in 3 specific metrics, which most coaches often overlook. Here are these 3 metrics, along with tips on how…

Former Motorola pro (59) aims for hour record – using INSCYD
From 7-Eleven to Motorola to Saturn to INSCYD. Norman Alvis – retired Pro, multi-national champion and world record holder – has turned INSCYD to go beyond… Norman Alvis at Motorola (1994) vs Norman Alvis now Norman lives in Colorado Springs where he set a US Hour Record late in his pro career, 1997. The distance…

5 Iconic High-Intensity Interval Training (HIIT) Workouts For Endurance Athletes
High-Intensity Interval Training, or HIIT is a popular training method among athletes, including cyclists and runners, who want to make the most of their training time. In this article, we bring you the top 5 HIIT workouts for endurance athletes and guide you on choosing the training methods that suit your needs the best. By…

Should my Track and Field runner increase or decrease VLamax?
In our previous article about Why the best track and field running coaches look beyond VO2max, we talked about the importance of knowing your athlete’s anaerobic power (VLamax). We showed that having a too low VLamax can easily cost you more than 5 seconds in an 800m race, while a too high VLamax can cost…

3 Reasons Why Every Coach And Athlete Should Use Performance Testing
Are you looking for a way to boost your performance as a coach or athlete? Then you need to consider performance testing. In this article, we’ll cover the top 3 reasons why the best coaches use metabolic testing, whether you’re working with a professional or amateur athlete. What is performance testing? Before we dive into…

INSCYD and Zwift: race stronger by training & testing indoors
Although running, cycling, triathlon – and the majority of other sports – are still performed outdoors, indoor training and (remote) indoor testing are both very popular. Even in the professional world, the digitalization of training software and performance analysis tools are common practice. But take two digital platforms (let’s say INSCYD and Zwift), blend them…

Eliud Kipchoge’s Physiology: Uncovering the Secrets Behind the INEOS 1:59 Marathon
When Eliud Kipchoge crossed the finish line at the INEOS 1:59 Challenge in Vienna, he not only completed a marathon in under two hours but also shattered a seemingly insurmountable human performance boundary. What made such a feat possible? We’ve delved into the potential physiology behind the 1:59 Challenge, and the findings are astounding… To…

Webinar: Mistakes you need to avoid when using a training method | INSCYD X AZUM
Join Sebastian Weber, Founder of INSCYD, and Reinout Van Schuylenbergh, an esteemed coach with over 30 years of experience in endurance sports, as they impart invaluable knowledge on leveraging state-of-the-art training methods to maximize your endurance training. Join us for a webinar where Sebastian Weber, who is the project leader of INSCYD will share insights…

How to Calculate and Measure VO2Max: Testing Outside a Lab
Discover how to measure VO2max without visiting a professional lab, utilizing field tests, sports watches, or online calculators. This article explains different ways to measure your VO2max without requiring expensive lab equipment. Let’s explore these methods and their precision in calculating your VO2 max. Image: INSCYD Partner COSMED Spread the knowledge! Share this article with…

How to Train & Run Your Best 5K: 3 Steps for Beginners and Pros
If you’re looking to run your best 5K race, National and State Champion coach Benjamin Tilus has a secret recipe for both beginners and professional runners. Follow these 3 steps to improve your performance and win your next race. Whether you’re a runner or a coach, this comprehensive guide to 5k race training is packed with valuable…

INSCYD launches a revolutionary Training Zone Builder
Are you still using training zones based on a percentage of FTP, Anaerobic threshold or fixed lactate concentrations? Do you get the feeling that two athletes training in the same zone don’t show the same adaptation to the same training? If this sounds familiar then it is time for a change! https://youtu.be/hZELSARsJtA With INSCYD’s new…

A Good VO2max Charts by: Age, Gender, Sport and Athlete Fitness
Whether a VO2max of 50 is good depends on your age and gender. Moreover, while average VO2max values tell you something about your health, athletes should compare their VO2max with other athletes, not the general population. That’s why in this article we provide numerous VO2max comparison charts, based on age and gender, for both athletes…

INSCYD partners with CANYON//SRAM
Salenstein, Switzerland / Leipzig, Germany. July 7th, 2022 INSCYD and CANYON//SRAM have signed a partnership agreement. INSCYD becomes the official performance software supplier of the women’s cycling team CANYON//SRAM. With fifteen riders from eleven different countries, CANYON//SRAM Racing is home to a diverse group of highly ambitious women. The team is currently racing the Giro…

Increase Triathlon Performance: 3 Effective but Uncommon Ways
Improving your VO2max or increasing your threshold is a time consuming process that we talk about all the time. Not this time. In this article we share 3 training tips that will increase your triathlon performance in a time efficient manner. Are you looking to increase your triathlon performance? Or maybe even preparing yourself for…

Success in XC Mountain Biking: How INSCYD Elevated an Athlete to World-Class Ranking
Mountain biking is significantly different from road cycling – you can’t just use the same training prescription. Elite coach Janis Musins reveals how he transformed Martin Blums from a rank around 50 to an impressive 11th place on the World XC ranking, using INSCYD performance software. Spread the knowledge! Share this article with your fellow…

How To Interpret A Shift In Lactate Curves – The Right Way
Many labs and coaches use lactate threshold graphs to measure progress in their athletes. However, when analyzing a lactate threshold chart, it’s important to know exactly which factors cause a shift in the lactate curve. After reading this article, you will understand why a right shift in the lactate curve can be a bad thing.…

Colorado Performance Workshop
1) The metabolic origin of the anaerobic threshold. It is one of sports most used terms when it comes to endurance performance and the most important benchmark value. However, most people do not understand what it is and why it even exists. 2) Athlete performance profiling – beyond critical power testing. Critical power testing has…

What is INSCYD
INSCYD is the most advanced software tool to analyze physiological performance in athletes. INSCYD enables coaches to create highly individual and laser focused training programs. INSCYD gives you access to metrics otherwise only available to elite trainers and high-end institutes – such as the only tool to provide maximum glycolytic power (VLamax) for any kind…

Lactate Threshold 1 (LT1): Ultimate Guide to Improving Endurance Training
Lactate threshold 1 (LT1) – also known as the aerobic threshold – is the little brother of LT2 or anaerobic threshold. LT1 may not get as much attention as LT2, but it’s still a key ingredient of famous cycling, running, and triathlon training methods. This includes Polarized training, Pyramidal training and the Norwegian Method. This article…

From Power to Physiology: the mechanics of the Power-Performance Decoder
Power output recorded in training and racing isn’t separated from the physiology of the athlete. In fact, the power output one sees on his powermeter are actually created by the physiology of the athlete. INSCYD’s Power-Performance Decoder (PPD) is the first tool ever to combine field- and lab data, it enables coaches to see,…

How triathletes qualify and prepare for IRONMAN Kona
Many INSCYD athletes and coaches qualified and prepared for IRONMAN Kona, Hawaii. In this article we bundle their tips and tricks. Spread the knowledge! Share this article with your fellow coaches and athletes. Click the share buttons below and inspire others on their journey to athletic excellence. Facebook Twitter LinkedIn Reddit Email Table of Contents…

Why the best track and field running coaches look beyond VO2max
Are you still using Jack Daniels’ running formula to determine athlete VO2? Are VO2max and anaerobic threshold the only metrics that you test for? Is your high VO2 athlete not winning all races? Then this article gives you the missing piece of the puzzle! Ben Tilus, National and State Champion coach in track and field…

How INSCYD develops and validates new technology: a look behind the scenes
Some of our technologies seem so ground-breaking, that it might seem too good to be true. Questions we often hear are: “how come INSCYD is able to measure the VLamax while others fail to do so?” or “How is it possible that the Cycling PPD only needs 4 all out efforts, but still results in…

Hand in hand: INSCYD collaborates with famous company Carmichael Training Systems (CTS) to revolutionise performance diagnostics
Salenstein, Switzerland./ Colorado Sprints, USA January 12th, 2021. Two of the most innovative and best performing companies have joined forces. The coaching company Carmichael Training Systems (CTS) brings on board the analysis software and the unique training science tool INSCYD to support their performance diagnostic work. Carmichael Training Systems is the premier destination for world-class…

5 Training Tips to Decrease VLamax
Want to reduce your VLamax so you burn less carbohydrates and increase your anaerobic threshold? Here are 5 training tips on how to decrease VLamax, talking about: training intensity, frequency and nutrition! PS you can also download the tips in PDF. Having a high VLamax will make you go faster in any sprint or attack*.…

Webinar: Unlocking the Hourglass Model: A Revolutionary Approach to Race Preparation
Join Benjamin Tilus, National Champion Coach and Founder of XLR8 Performance Lab, as he demystifies the art of race preparation with the revolutionary “hourglass” model. This transformative approach has been pivotal in securing the US National title and has the potential to redefine endurance training across sports. Join us for this transformative session and equip…

SEG RACING ACADEMY PARTNERS UP WITH INSCYD
(Tägerwilen, Switzerland, 8 March 2019) – INSCYD, the world’s most advanced software for performance analysis, and SEG Racing Academy partnered up for the next three years. Talent Support & Identification SEG Racing Academy is an U23 development team that competes at continental level with the aim of educating and developing riders to the next step.…

How to Set up Efficient Athlete Training Programs
In this partner webinar with Azum, Sebastian Weber talks about creating efficient and effective training plans. Theoretical basics are linked with application examples from practice. Agenda Differentiating primary and secondary goals Timing, timing, timing: how long, how often, how many repetitions? Periodization & Structure: introduction use of macro-nutrients to make informed decisions about training &…

Zone 2 Training: Benefits, Science, and How-To Guide
Zone 2 training is promoted as your go-to training intensity, whether you’re a professional athlete or simply looking for exercise health benefits. Zone 2 training gained popularity when the coach of Tour de France winner Tadej Pogačar revealed that his athlete spends 80% of the training days in zone 2. In this article we talk…

INSCYD partners with Fast Talk Laboratories
Chris Case and Trevor Connor of Fast Talk Laboratories performing an INSCYD test Salenstein, Switzerland / Boulder, Colorado, USA At INSCYD we celebrate all our new partnerships, and this is one we cannot keep to ourselves. We are happy to announce our new partnership with Fast Talk Laboratories! About Fast Talk and Fast Talk Laboratories…

Using metabolic profiling to streamline training programs
Dan Lorang talks about how he uses metabolic data of his athletes to create more efficient training programs: Performance Management at Team BORA-hansgrohe Assessing athletic performance in the field and in the lab Apply results to daily training programs Apply results to daily training programs The Presenter Dan Lorang is one of the most successful…

Belgian Hammers – Road to Olympic Mixed Team Relay
The Belgian Triathlon Team Mixed Relay won the Olympic qualifier in Lisbon. As a result, they will compete in the Tokyo Olympics on July 31. What is their formula for success and how do they use INSCYD to create race winning training programs? Read it in this blog. ABOUT THE TRIATHLON MIXED TEAM RELAY Triathlon…

The Future of Cycling Training: Insights from Former Pro Cyclist
Together with former professional cyclist and INSCYD user Peter Pouly, we talk about the future of cycling training and how that affects endurance coaches and their business. Peter is a former professional cyclist (5x National Champion Cross-Country Mountain Bike, 5x winner Haute Route Alps, 1x winner La Marmotte) and now works as a Directeur Sportif for…

How women can train and fuel for their unique physiology
Lift heavy is the number one tip that all female athletes in perimenopause and beyond can take on to stay strong and play to their best. Eat more protein is another. But what about those endurance goals that we love training for? How do you balance “going long” with doing strength and intensity? How do…

INSCYD partners up with cycling team Corendon-Circus for 2020 season
Salenstein, Switzerland. September 26th. INSCYD — the world’s most advanced software for performance analysis — has signed a three -year contract with the Pro Continental cycling team Corendon-Circus ahead of the next cycling seasons. INSCYD will provide the team with its cutting-edge technology for performance analysis. The team’s Performance Manager Kristof De Kegel — who has…

Part 2. Metrics all Runners should know: Lactate accumulation and Recovery
In the previous blog we talked about the importance of knowing fundamental running metrics like VO2max, VLamax, Fat combustion and Carbohydrate combustion. We saw how knowing those metrics makes you a faster runner instantaneously. In this blog we’ll show you how knowing your lactate accumulation and recovery will optimize interval training. How VO2max and VLamax…

Over-Under Intervals: Benefits, Mistakes, and How to Create Effective Workouts
Over-under training is a type of interval training that alternates between intensities above the anaerobic threshold or FTP and those below it. The primary objective is to accumulate fatigue and lactate during the “over” interval and then efficiently clear it during the “under” interval. But how can coaches ensure they’re getting the intensities just right…

Indoor vs Outdoor testing for Runners: Which is better?
Can you compare indoor lab tests with outdoor field test? The comprehensive results of a complete physiological assessment can help you to plan your training sessions and nutrition more effectively. It’s a necessity for elite runners and it’s even a good idea for recreational runners that are training for a specific time in an upcoming…

Use case: becoming National TT Champion using INSCYD
In this blog, Sport Scientist Dylan Lindsey shares how he coached Sarah Gigante towards the National TT Championships. He specifically dives into the benefits of using the Lactate: Recovery & Accumulation graph. Ready to learn how to become a national TT champion? Let’s start! Sarah Gigante: National TT Champion 2021 After a long hiatus from…

The Ultimate Guide to Zone 4 Training (Threshold Training): Science, Strategy, and Application
Zone 4 training, also known as threshold training, is used by the world’s best triathletes and marathon runners. But the true training effect of zone 4 training is not as straightforward as many coaches and athletes think. This article covers the science and practical applications of zone 4 training. Spread the knowledge! Share this article…

INSCYD integrates Heart Rate in Training Zones
We are happy to announce that from now on, heart rate is integrated into our training zones. That means you can now describe a FatMax training zone – or any other training zone – based on heart rate. Image: INSCYD partner Triathlon Training Academy In the past, INSCYD training zones were described based on speed…

INSCYD test: protocol, results, cost and more.
This article covers everything you need to know about the INSCYD testing protocols, test results, testing cost and many more. Let’s start by addressing a common misunderstanding. Image: INSCYD partner Triathlon Training Academy Before we can dive into the INSCYD test, we have to understand what INSCYD is. INSCYD is a software tool that allows…

The Physiology Behind Power-Duration Curves
Power vs. Duration respectively Speed vs. Duration analysis has a long history in sport science.Power-Duration relationships have become very popular and also very useful in managing training & performance in endurance sports – particularly in cycling. It provides a relatively easy way to get an idea of the performance of an athlete. Watch the webinar:…

Eli Iserbyt shares his INSCYD insights
“While everyone is obsessed with power data, INSCYD enables me to go beyond the superficial and understand my body better.” Cyclocross professional Eli Iserbyt shares what he learned from INSCYD and how he puts this into practice. Cyclocross professional Eli Iserbyt shares his INSCYD experience (photo: PhotopressBE) What triggers a 6x Belgian champion, 3x European…

Breaking the ice of Iceland’s swimming performances
Iceland is often associated with geysers, volcanoes, cold water and a generally hostile landscape. Although it’s an island, you hardly think of Iceland as a swimming country or destination. But even this remote country, home to more than 300,000 inhabitants, has its own swimming federation – the Sundsamband Íslands, SSÍ. And its swimmers have already…

The Ultimate Guide to Running Economy: How to Improve and Measure It
Improving running economy is probably the most efficient way to shave off minutes from your 10k or (half) marathon time. At the same time, it’s an overlooked metric that is often wrongly measured. That’s why it’s time for a change! This comprehensive guide covers everything you need to know about running economy (RE): from theory…

Muscle Glycogen and Exercise: all you need to know
Muscle Glycogen and Exercise: all you need to know Glycogen is the most important energy substrate during exercise, especially at higher intensities. Since most races require such high intensities, glycogen is important to every athlete who wants to be strong, fast and become a winner. Regardless of the intensity at which you exercise, at some…

Part 1. Metrics all Runners should know: Fat & Carbohydrate utilization
It almost looks like a new running metric is introduced every day. This makes it easy to lose sight on the metrics that are important and fundamental. In this blog we don’t want to get lost in details like cadence, stride length and ground contact time. Instead, we are going to look at the big…

3 Training Tips to increase fat combustion
Here’s how to increase your fat combustion, be less dependent on precious carbohydrates and sustain a higher exercise intensity for a longer amount of time. These 3 tips talk about what to avoid in training, what (not) to eat and your overall long term training goal. PS you can also download the tips in PDF.…

INSCYD PARTNERS WITH VELOCITY
Velocity is a new performance-driven indoor cycling app that is designed to make cyclists faster by customizing their training to their physiology. To accomplish this, Velocity will leverage INSCYD’s proprietary software and comprehensive experience with elite athletes to provide riders with their unique metabolic profile. Readers may think of Zwift when hearing “indoor cycling app”,…

Stop using old-fashioned Training Zones – instead try this
The way training zones are determined and used hasn’t changed for decades, as if nothing happened in sport science lately. It’s time to throw them out of the window and start creating training zones that actually matter. Let’s start right away. TRAINING ZONES MOST COACHES USE – AND WHY IT’S TIME FOR A CHANGE Currently,…

The Secret to World Tour Rider Ryan Mullen gaining 15% power in 4 weeks
In this webinar, we share the story of Ryan Mullen turning his season around. After performing an INSCYD test he changed his training, gained 15% power in 4 weeks time, and won both National Time Trial & Road Race with just a few days. Watch the webinar: Agenda timestamps: [00:00] Introduction: how Ryan Mullen and…

How to Increase VO2Max: Techniques to Improve Performance
Increasing VO2max can be easy at first, but becomes challenging when you already have a decent training history. In this article we talk about all the advanced methods that improve VO2max. From training to nutrition. We also cover how to overcome a plateau in VO2max and common mistakes to avoid when trying to increase VO2max.…

Why FatMax is not the best endurance training intensity per se
There are many reasons why endurance athletes should want to increase their fat combustion. Riding many hours at FatMax (intensity at which you burn the most fat) might seem like the best way to do this. However, this is not always the case. It can even harm you and cause overtraining. Here’s what you should…

SHaRK: the Belgium role model for developing young swimmers
Sometimes you need that extra advantage to win against your competitors. Sometimes you want to teach your team the intricacy of human physiology. And sometimes you just want to develop your squad and bring the youngsters to an elite level. It doesn’t matter what your goal is: INSCYD will help you to achieve it. The…

Undercover test: INSCYDs Power-Performance Decoder versus lab gold standard
Exercise Physiologist Tero Joutsen, PhD, rideson the treadmill during a 30min constant load test – the gold standard for validation of the maximum lactate steady state (AKA anaerobic threshold / FTP) Advertising claims are often designed to make more out of products than they actually are. INSCYD’s Power-Performance Decoder (PPD) software doesn’t have a claim.…

Webinar: Swimming Performance Test, Application in Training and Case Study
This webinar covers everything you need to know about swimming performance tests. From the test (protocol) itself, to the results and application. Alexander Törpel (Head of Diagnostics – German Swimming Federation) talks about the application of test results in training. You’ll get unique insights into the (longitudinal) development of performance metrics, of 2 Professional National…

40-20 Interval Workout: Work-To-Rest Ratios in HIIT
Are 40-20’s (40s ON 20s OFF) the best work to rest ratios in HIIT intervals? Or should you consider 30-30 Billat intervals? Both are common in endurance sports like cycling and running, and recent scientific literature shows why. Continue reading to learn more about work-to-rest ratios in HIIT training. Spread the knowledge! Share this article…

When and how often should you do metabolic test?
How often should you do an exercise test? And maybe even more important: when should you do such a sports performance physiology test? Read it in this blog or click here to start listening to the podcast! In the Faster Podcast by FLO, Sebastian Weber talks about how often athletes should perform a metabolic test…

Mastering the Monuments
Peter Sagen in Gent-Wevelgem 2018 The spring Classics season is already finished, a moment that always leaves cycling fans with a bit of sadness in their hearts. But for INSCYD and team BORA – hansgrohe the first quarter of the year has been a blast. Watching Peter Sagan winning his first Paris-Roubaix wearing the World…
One test = One tree!
Since august 2020 we proudly work together with Eden Reforestation Projects. For every INSCYD test sold, we plant a tree! By doing so, we try to support the re-forestation of our planet. We are happy to announce we planted over 2500 trees since we started this collaboration.

How INSCYD Empowers Small-Scale Coaches & Amateur Athletes
INSCYD is known for its partnerships with national federations and professional teams. However, small-scale (one-man) coaching businesses and their amateur athletes can also significantly benefit from INSCYD. This article covers common reasons why (part-time) coaches are hesitant, but extremely successful once they start using INSCYD. Consider a typical athlete who trains slightly more than 5…

Finnish Triathlon Association coach Mika Luoto talks INSCYD
When Mika Luoto – coaching monitor of the Finnish Triathlon Association – heard about INSCYD years ago, he was very skeptical. Will it add value? Is their field test without any lactate or oxygen measurement reliable? In this interview he explains how comparing his own lab test results with INSCYD results convinced him to work…

CANYON//SRAM Racing about the practical use of INSCYD
Join CANYON//SRAM Racing rider, Ella Harris, and the team’s performance coach, Stephen Gallagher from Dig Deep Coaching, for a dive into the practical use of the INSCYD software. They’ll discuss the insights from various testing protocols and real-life examples of how these understandings have helped shape and improve performances across training, racing and recovery. Agenda:…

Use case: rehabilitation program using INSCYD
James (39) is self-employed, working long hours and having to fit training in around his demanding physical job. His results had plateaued and he was finding it difficult to structure his training and balance his work/life commitments. As a result, he was struggling to improve his performance enough to warrant the time and energy necessary…

Successfully Coaching Athletes Towards Ironman Hawaii Qualification – Case Study
Olympian and former professional triathlete, Jean-Christophe Guinchard, shares his 35 years of experience in coaching. He is the co-founder of JC Sports Coaching and a member of Sansego Tri club, a group of high-level coaches working together to provide the best for athletes. Today, he coaches 42 athletes, including triathletes and trail runners, and is…

Glycolytic Power in swimming : the missing link
Because of the relatively short duration of swim races, the anaerobic energy production plays a huge and significant role. It therefore makes sense to learn more about this race winning energy system, that not many coaches take into account. A French national team member gets his lactate sample taken after an exhaustive exercise to determine…

How Power is Composed and Why This Matters
Yes, power has advantages over speed and heart rate. But if you want to fully exploit its potential, you need to know how your running or cycling power is composed. How much power is coming from the aerobic vs the anaerobic energy system? And which fuel source contributes most to your power output? In this…

Webinar: Uncommon Strategies to Increase Triathlon Performance
Watch the webinar where Sebastian Weber, who is the project leader of INSCYD will share insights on effective but uncommon strategies to increase triathlon performance. Learn how to increase your swimming economy, optimize your carbohydrate intake, improve your running economy and more. Join us for a webinar where Sebastian Weber, who is the project leader of INSCYD will share insights…

Understanding VO2max: What Is It And How It Affects Athlete Performance
Understanding VO2Max: What Is It and How It Affects Athlete Performance In the realm of endurance sports, understanding performance data and metrics is vital. A common question that emerges among athletes is “what’s your FTP?” or even more specific: “what is your power-to-weight ratio?”. However, both FTP and power-to-weight ratio are heavily dependent on a…

[Ultimate Guide] Zone 3 Training: Sweet Spot or Grey Zone?
Some refer to zone 3 training as sweet spot training while others call it the grey zone. This article reveals what zone 3 training is and when you should or shouldn’t implement it into your endurance training program. Spread the knowledge! Share this article with your fellow coaches and athletes. Click the share buttons below…

Polarized training vs Pyramidal training – Which Method Suits For Your Athlete?
Polarized training began as an observation of how elite endurance athletes train: 80% at low intensity, 20% at high intensity. But is polarized training better than pyramidal training for you? Let’s find out! Knowledge is power in the world of athletic training. By sharing this comprehensive article on polarized and pyramidal training, you’re empowering your…

Implement This Olympic Coaching Method That Boost Athlete Coaching Business
Olympic mountain biking coach Filip François reveals his coaching structure, which leads to proven top performance and coaching business success. When I started my coaching business together with my wife (two times cross country Olympian) we wanted to give our athletes the best coaching possible. We chose to use INSCYD, because we already worked with it during the…

How to use the metabolic profile in INSCYD to create better training programs
Mathieu Heijboer – Head of Performance at World Tour Cycling Team Jumbo-Visma is presenting on how he used INSCYD metabolic profiling to coach his athletes in the most successful campaign of the team – 2019. Mathieu shows example test protocols his team uses along with example results. He then dives into how he uses the…

Create A Nutrition Plan For Training And Racing
In this post you learn 5 actionable steps to create a nutrition plan for training and racing. In fact, this is the exact process that partners like Alpecin-Deceuninck Cycling Team and the Belgium Triathlon Federation use to create a fueling plan. So if you want to know what and how much you should eat during training and…

How Peak and Fade (Pre Loaded) Intervals Can Boost Athletic Performance
Peak and fade intervals are a key component in the training regimens of elite athletes. These Peak and Fade Intervals start at a very high intensity and gradually decrease, offering a unique approach to training. This article not only delves into the science behind Peak and Fade Intervals but also covers pre-loaded intervals, another effective…

Does the anaerobic threshold really occur at 4 mmol/l blood lactate?
Many performance labs and coaches determine the anaerobic threshold based on a lactate concentration of 4 mmol/l during an incremental test. This article answers whether that is a valid method of assessing the anaerobic- or lactate threshold. By Loek Vossen Share this insightful article with athletes, coaches, and sports enthusiasts who can benefit from a deeper…

Race fueling strategies: how to use carbohydrate combustion rates
Carbohydrate and fat combustion rates are among the most important features INSCYD can offer for runners, triathletes, and cyclists. Here’s why: While fat combustion rates are a valid marker to monitor training progress and set training intensity zones, carbohydrate combustion is crucial not only in training – but even more in a race. Carbohydrate storage…

Aerodynamics, Biomechanics & Metabolism – shaving off > 1h in IRONMAN
This webinar will teach you how to use a holistic approach, utilising biomechanics, aerodynamics, training and nutrition to tremendously increase the performance of a triathlete in no time. Learn how to use real world biomechanical analysis, nutrition strategies and efficient training programs to maximize value of your coaching and bike fitting service. High Performance Expert…

Mesics vs INSCYD: The Best Software For Lactate Tests
Not sure which software to use for analyzing lactate tests in your human performance lab? Checkout this comparison between Mesics (LC lactate) vs INSCYD, and decide which tool fits your lactate- and spiroergometry diagnostics lab best. To prevent confusion: Mesics is the company name. Their product is called Winlactat. Soon the product name will change…

How To Apply The Norwegian Method To Training
The Norwegian Training Method is gaining attention after the success of Gustav Iden and Kristian Blummenfelt in triathlon. In this blog post, you will learn how to apply the Norwegian Method in 3 simple steps to increase your triathlon performance. We will discuss the training philosophy, how to control intensity with lactate measurements, and the…

Swimming performance: test protocols & most valued results
In this webinar, we share which performance metrics make the difference in swimming, how you can measure those and how you put them into practice. Watch the webinar: Agenda timestamps: [01:29] Physiological testing in swimming: which metrics are of interest? [02:40] VO2max – Maximum aerobic performance. How to test VO2max without measuring it during the…

Double Olympian Brendan Reilly joins INSCYD
(Tägerwilen, Switzerland, 2nd September 2019) –Double Olympian Brendan Reilly joins INSCYD to develop partnerships with coaches and athletes worldwide INSCYD — the world’s most advanced software for performance analysis — has announced the appointment of double Olympian Brendan Reilly as its new Partnerships Manager. Reilly, who competed at Olympic level in high jumping for over…

Florian Wellbrock Wins Gold in 2023 World Championships
Florian Wellbrock has continued to make waves in the swimming world with his recent achievements. He pulled away for an 18.7-second win in the Open Water 10K at the World Championships, showcasing his dominance in the sport. This win was Germany’s second in two 10K races in Fukuoka, marking a significant milestone for the country…

Thriving as a Sports Coach in the Age of ChatGPT and AI Revolution
AI in sports has become a hot topic, with many coaches concerned about the impact of advanced technologies like ChatGPT on coaching. This article addresses these concerns and demonstrates how coaches can not only stay relevant but thrive in the age of AI. Discover 3 strategies for integrating ChatGPT and other AI tools into your…

The Power Behind a Tour de France Sprint Win: The Champs-Élysées
In the 2023 Tour de France, Jasper Philipsen, riding for the INSCYD partner Alpecin-Deceuninck team, has demonstrated his sprinting prowess by securing four stage wins and six podium finishes. Philipsen’s victories don’t stop there. He has been utterly dominant in the 2023 Tour de France, especially in the bunch sprints. Here’s what it takes to…

Lactate accumulation & recovery
Lactate accumulation & recovery Accumulation of lactate is associated with fatigue and time to exhaustion during hard exercise. The time an athlete needs to recover from such an accumulation and the intensity he or she can handle during this are crucial for success in some sports like cycling and football. Furthermore knowledge about accumulation and…

Case study: performance testing in Swimming
This case study is about an 800 meter National Swimmer who is not able to keep up with her teammate during training and racing. Observations and lactate measurements seem to indicate she needs to improve her aerobic energy system, but this turns out to be a false assumption. Read the article and register for the…

VLamax: Elite Coaches Secret Weapon
VLamax: Elite Coaches Secret Weapon Are you a cyclist looking to sprint faster than Wout van Aert? Or a triathlete dreaming of racing with Jan Frodeno at the next Ironman World Championships? These may be hard goals, but a good way to start working towards them is to understand a very important metric of human…

3 Tips For Triathlon Coaches – From an IRONMAN Kona Coach
Aya Sinay has raced as a triathlete in IRONMAN Kona (Hawaii) twice and has been a successful triathlete coach for over 10 years. In this article, she shares 3 important tips that all triathlete coaches should read. Get ready to boost your athletes’ performance and your coaching business. Spread the knowledge! Share this article with…

How mid distance running coaches use INSCYD – case study
INSCYD’er and short distance runner Vanessa Scaunet during the European Championships Indoor, Torun 2021. More and more running coaches use INSCYD to create better training programs and race pacing for their athletes. This blog covers the story of Vanessa Scaunet, who was able to switch her running goal from a 2k cross country to an…

For maximum performance: Belgian Cycling partners with INSCYD on a long-term cooperation
Salenstein, Switzerland. June 3rd 2020 . INSCYD and Belgian Cycling have just signed four-year cooperation agreement. This partnership includes all divisions of the national cycling association, i.e., INSCYD will support the disciplines road cycling, mountain biking, cyclocross, BMX and track cycling in their pursuit of maximum performance. Expert education for coaches After a several months long…

Talent Development Using INSCYD: Insights from Champion Team
Team Sportforum has one mission: to become the best amateur cycling team in Germany. Head of Performance, Luke Derksen, shares how they use INSCYD for talent identification, progress monitoring, predicting future performances and deciding on race strategies. Image: INSCYD Partner Team Sportforum About Team Sportforum Our mission is to become the best amateur cycling team in…

Body composition in performance testing: stop ignoring it
Body composition in performance testing: stop ignoring it Body composition is highly important in athletic performance and performance testing. Although often ignored, body composition goes beyond weight and body fat. In lactate testing for instance, concentrations are expressed in mmol lactate per liter (mmol/L). But do you know which “liter” it is about? Let’s dive…

Two-Time Olympic athlete Brijesh Lawrence joins team INSCYD
As the INSCYD community grows, so does our team. We are happy to welcome track and field sprint expert, Brijesh Lawrence OLY. Introduction Brijesh Lawrence OLY Brijesh started running when he was 5, but noticed his Olympic potential when he studied at Doane University. He soon became a 100m & 200m specialist, winning a bronze…

Measuring Energy Demand in Swimming using simple Pool Tests
In this webinar we show how to measure the energy cost at a given swimming speed, using simple testing in the pool. About the webinar The energy cost at a given speed is decisive for the race performance in swimming. The methods shown in this webinar are all based on peer reviewed scientific publications. We…

It’s Never Too Late to Start Cycling and Qualify for Kona – if You Use INSCYD
Salim Mohammned getting an INSCYD test done by Jo Spindler Hard work will always beat talent (if talent is not trained). But if you’ve got a good set of genes and a strong work ethic, then you’re on the road to success.And that is true at any given phase in life. Just take Salim Mohammed,…

USA Triathlon Project Podium and INSCYD: Charting the Course for Olympic Triumph
In the quest for Olympic glory, USA Triathlon’s Project Podium has partnered with INSCYD, a leader in exercise physiology analytics, to revolutionize the training of America’s top young male triathletes. Head Coach Parker Spencer shares insights into this groundbreaking collaboration, aiming to turn potential into podiums at the 2028 Los Angeles Olympics. Watch Parker Spencer…

Breaking 7 at “La Marmotte” – with INSCYD
Henrik Kraglund on his way to break the 7-hour mark at La Marmotte 2019 There are several badges of honour in the world of endurance sports. For some, it is running a marathon in less than three hours, or qualifying for the Ironman World Championships. For pure cyclists, on the other hand, it can be…

Does VO2max Really Matter – Or Is It Overrated?
Scientists and coaches are openly questioning the importance of the most well-known performance metric in endurance sports – VO2max. This article answers whether VO2max actually matters for your sport performance. Let’s dive right into it! Spread the knowledge! Share this article with your fellow coaches and athletes. Click the share buttons below and inspire others…
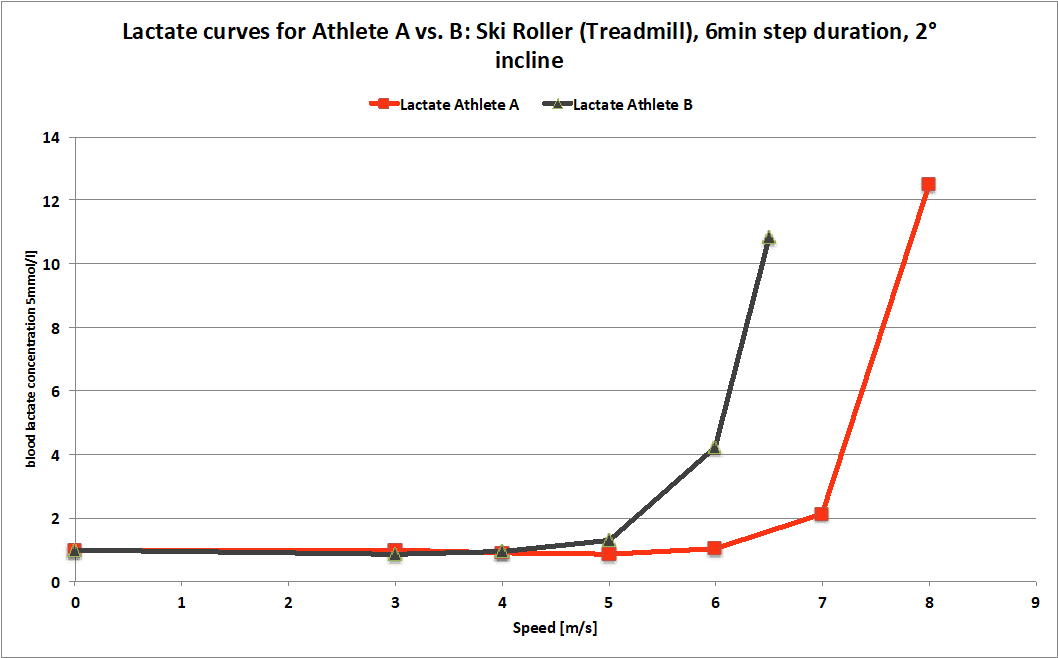
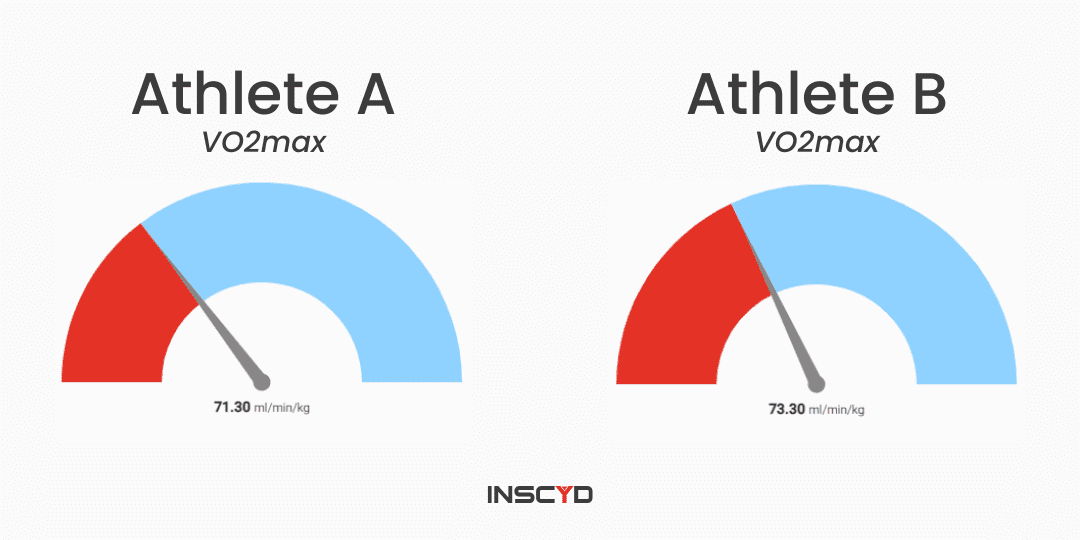
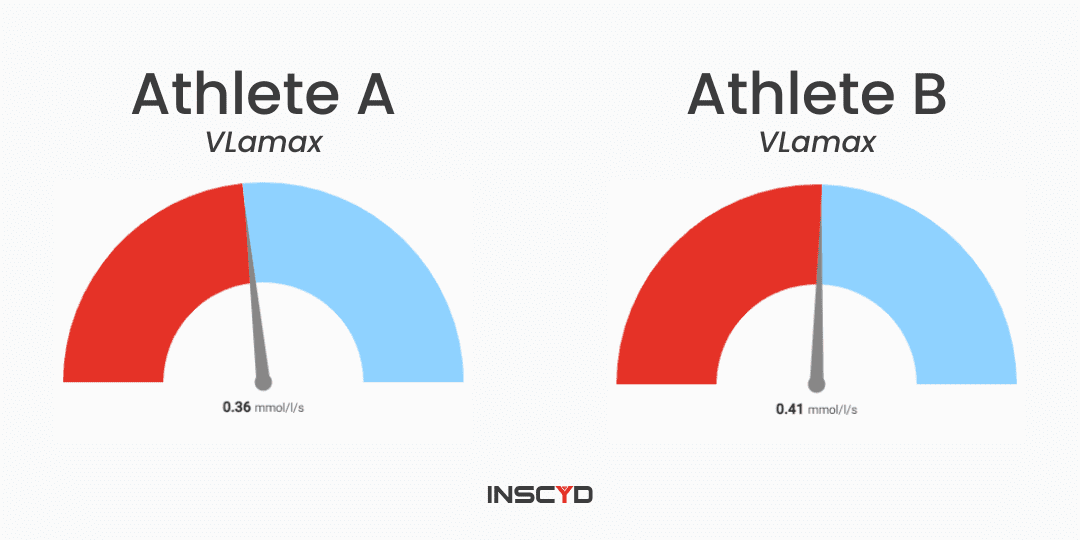
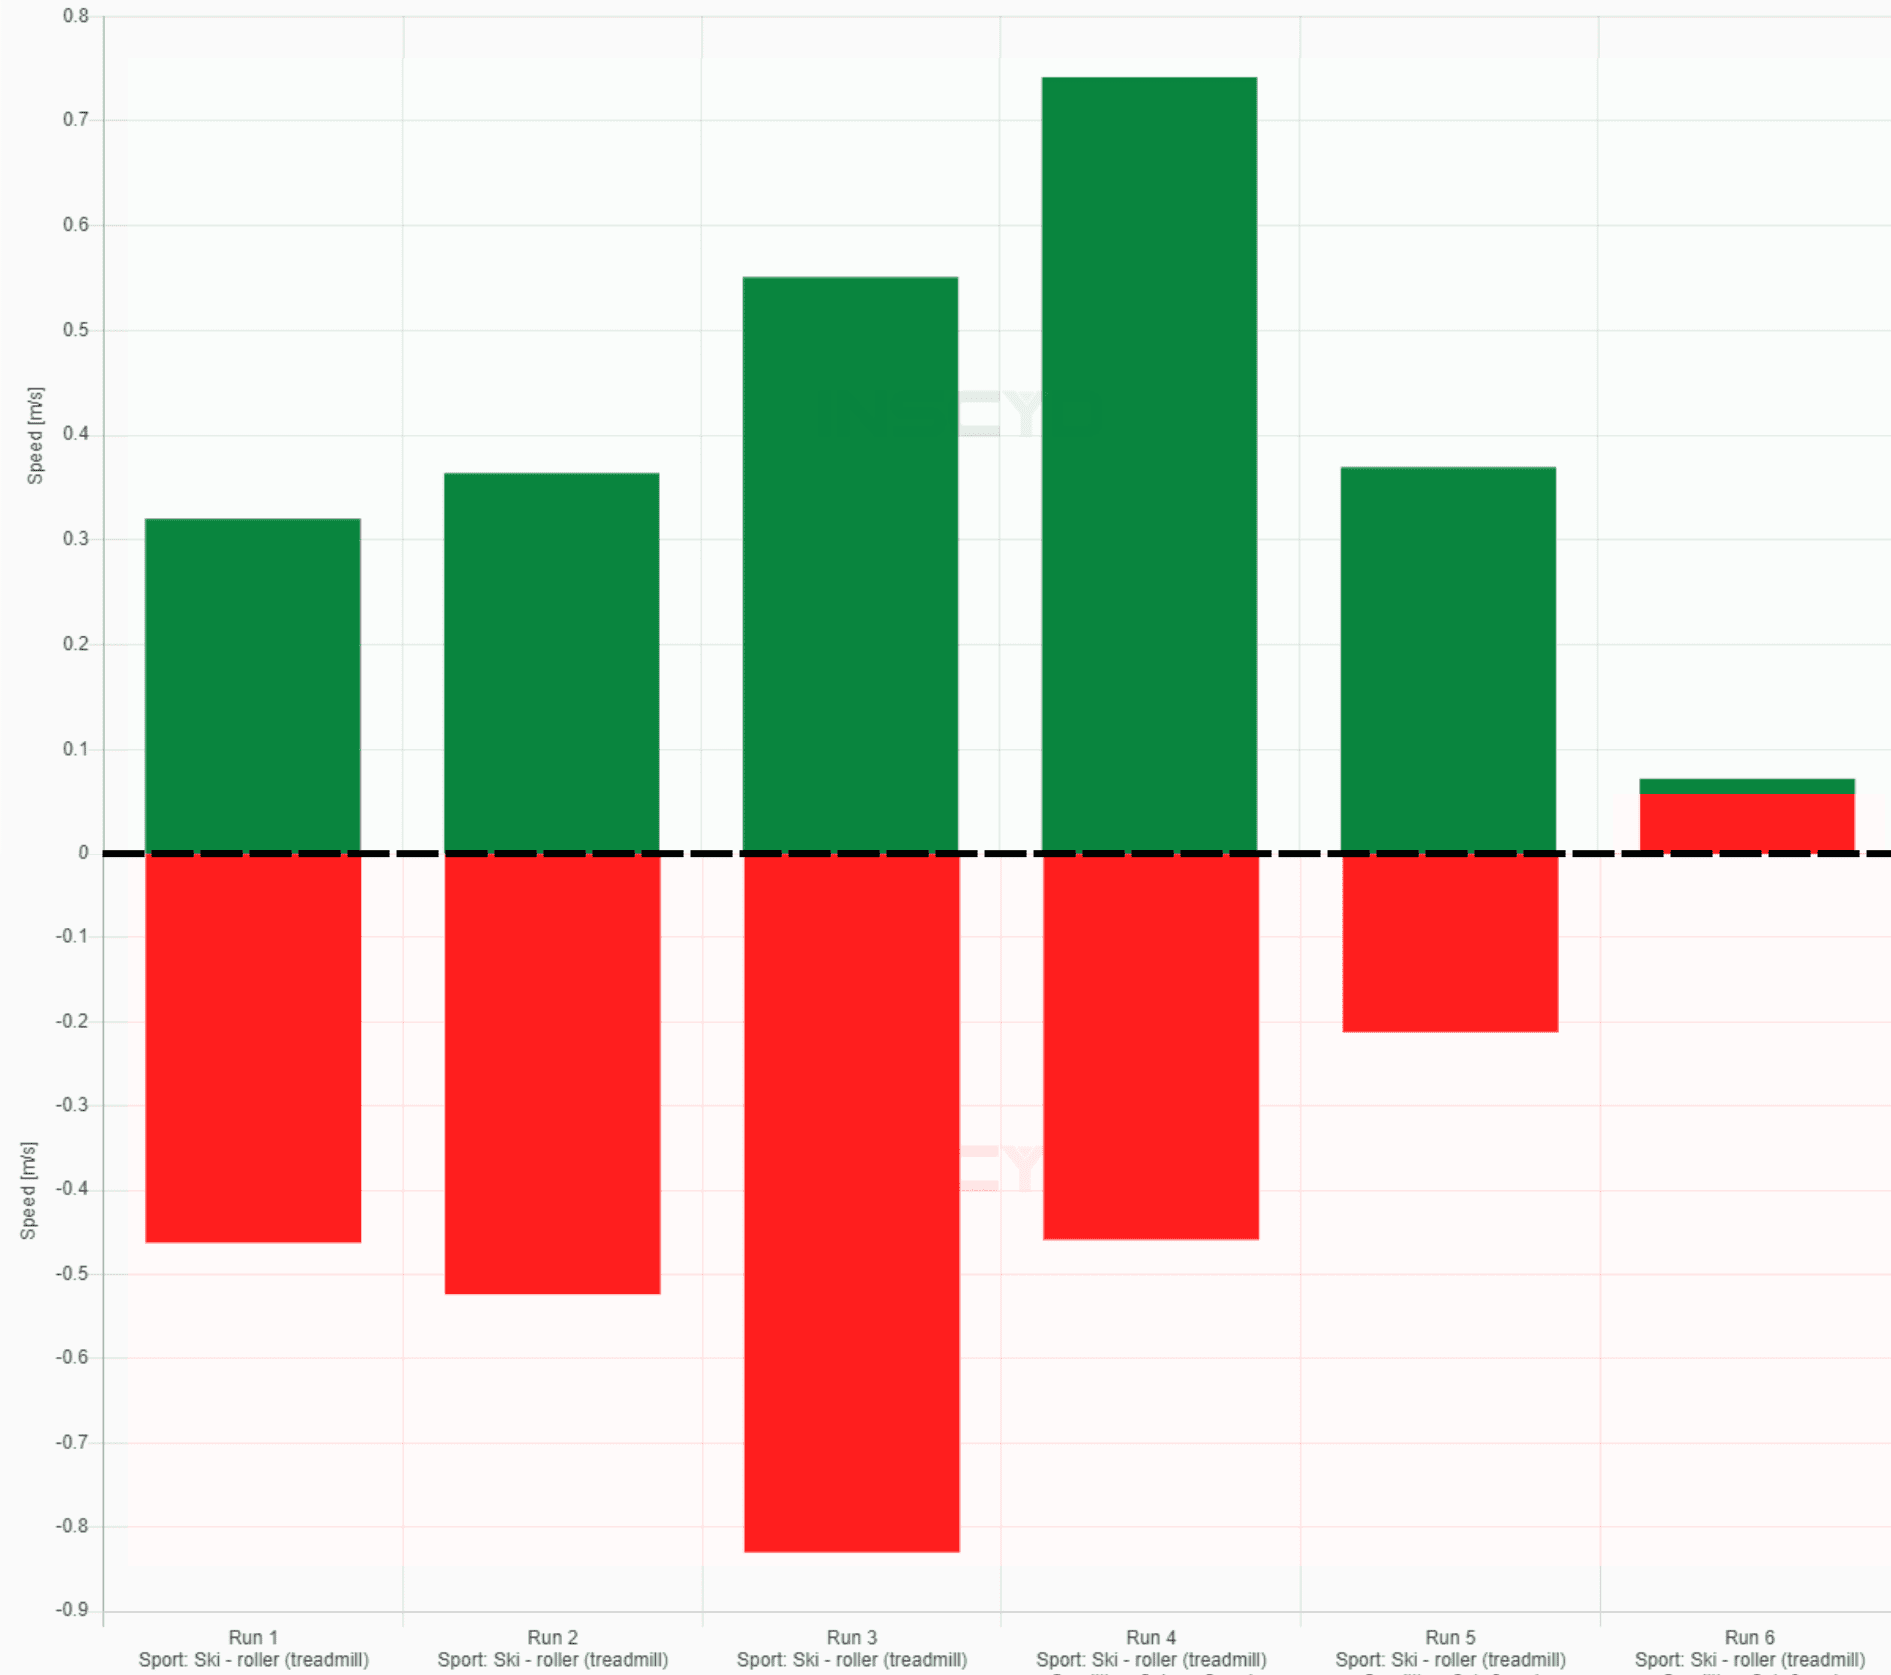
Case study: performance testing in Cross-Country (XC) Skiing
This case study is about a National Cross-Country (XC) Skier who is not able to keep up with his teammate during training and racing. Field observations and lactate measurements seem to indicate he needs to improve his aerobic energy system, but this turns out to be a false assumption. COMPARING 2 CROSS COUNTRY SKI ATHLETES:…
MESICS VS INSCYD: Die Beste Software Für Laktat-tests
Sind Sie sich nicht sicher, welche Software Sie zur Leistungsdiagnostik in Ihrem Labor verwenden sollen? Werfen Sie einen Blick auf diesen Vergleich zwischen Mesics Winlactat (LC-Laktat) vs. INSCYD und entscheiden Sie, welches Tool am besten zu Ihrem Laktat- und/oder Spiroergometrie-Diagnostiklabor passt. Um Verwirrungen zu vermeiden: Mesics ist der Firmenname. Ihr Produkt heißt Winlactat. Bald wird…

The magic of cycling: a balanced VO2max and VLamax [Podcast]
In this podcast, Colby Pearce and Sebastian Weber talk about the magic of cycling: having a strong aerobic metabolism that burns the lactate, produced by the (anaerobic) glycolytic metabolism. Are you able to recover from repeated accelerations? Colby Pearce during the podcast: “The glycolytic metabolism produces lactate – and a well trained aerobic metabolism consumes…

Use case: INSCYD x Running with (Stryd) power
In this use case, coach and sport scientist Florian Heck shares how he and his runners benefit from combining INSCYD software with (STRYD) running power data. Trail runner Josef. Source: Sportograf Florian Heck, coach and managing director at KickAss Sports, shares his story about testing and coaching an experienced trail runner, using INSCYD and STRYD.…

Science of VO2max Intervals: A Comprehensive Guide for Endurance Performance
VO2max intervals are a type of HIIT training that specifically aim to improve aerobic power (VO2max). Although many workouts increase VO2max aerobic power, VO2max intervals are often considered to last about 5 minutes. But why? Here’s how to create individually tailored VO2max intervals that work best for you. Spread the knowledge! Share this article with…

Wout van Aert reveals his secret: how to switch from cyclocross to road cycling
Cyclocross heroes seem to dominate in road cycling. How do cyclists like Thomas Pidcock, Wout van Aert and Mathieu van der Poel make the switch from a 60-minute cyclocross race to a 6-hour road race? In this blog, Wout van Aert – coached using INSCYD since 2017 – reveals his secret! In cyclocross, it is…

FatMax: definition, training (zone) and exercise test
FatMax: definition, training (zone) and exercise test Whether you like cycling, running or any other endurance exercise: knowing your FatMax zone will enable you to train your fat oxidation and boost your endurance performance. This blog contains everything you need to know about FatMax. From theory to practical application. Let’s dive right into it! WHAT…

Anaerobic threshold (FTP): why you might be overthinking it
How many times have you looked at your power meter or heart rate monitor and wondered if you were going too far above your threshold? Although it is reasonable not to kill yourself ‘just because’ when you’re out training and racing, you might be surprised by how little you actually know about one of the…

How coach Flo Heck used INSCYD on himself
Whether you’re considering becoming a coach or are already an experienced coach, we honestly can’t imagine a better way to test our physiological software than by using it on yourself (as a coach) before using it on your athletes. That’s what coach Florian Heck, 28 years old from Tri2gether (Trier, Germany), did with INSCYD. INSCYD…

Breaking 5: overcoming the bike split barrier in IRONMAN
McCutchen going sub-5 and improving his Ironman bike split by more than 10 minutes in just 12 months Going sub-5 for the bike leg of an Ironman is a true milestone. Getting even faster after this benchmark is clearly harder, but not impossible. Just look at age–grouper Matthew McCutchen (47) from Aliso Viejo, California. McCutchen…

Wie Trainer in Zeiten von ChatGPT und anderen KI-Revolutionen relevant bleiben
Werden ChatGPT und andere KI-Tools den menschliche Coach ersetzen? Hier sind 3 Möglichkeiten, wie man neue, innovative Technologien nutzen kann und sich gleichzeitig unersetzlich macht. Facebook Twitter LinkedIn Reddit Email Trainerwissen vs. ChatGPT Bevor wir uns mit den spezifischen Coaching-Qualitäten von ChatGPT befassen können, ist es wichtig zu verstehen, woher es sein Wissen bezieht. Laut…

How to take blood samples for lactate testing
Want to become a pro in taking blood samples for lactate testing? Start the e-learning: The complete guide to taking valid lactate samples.

Why you should – or shouldn’t base training intensities on anaerobic threshold / FTP
In this webinar we are going to take a close look at using anaerobic threshold / FTP for prescribing training intensities. What might be the possible limitations and most common errors in using anaerobic threshold / FTP as the sole performance benchmark? Watch the webinar: Agenda: The physiological definition of anaerobic threshold Intensity in competition…

Go Long, Ultra Long, With INSCYD
Want to race or run super long races, like the Race Across America, Cape Epic, Dirty Kanza or the Transcontinental? We’ve got you covered! As Certified Sports Nutritionist Coach Sofi Marin (INSCYD user since 2017) says: “During a 4-hour ride, you can underfuel and get away with it. However, during a 48-hour event, it’s essential…

How to increase or decrease VLamax in running
In our previous article, we showed how to find out whether your runner should increase or decrease VLamax. Now it’s time to answers the final question: how to increase or decrease VLamax and How to increase VO2max in the meantime. By Benjamin Tilus Download full article in PDF Ben Tilus, National and State Champion coach…

The Truth About Functional Threshold Power (FTP): Facts, Myths, Limitations and Alternatives
A Functional Threshold Power (FTP) test is easy to perform, you only need a power meter. However, the insights you get from knowing your FTP are also limited. In this article we share what science has to say about FTP. We also introduce a very similar test protocol that gives you a full view of …

Training Zones and Training Zone Builder – part 2
This webinar is about Training Zones and the new INSCYD Training Zone Builder (part 2). Watch the webinar: Agenda timestamps: [01:00] Creating zones with TZB: the Master Metrics [02:35] Energy contribution: aerobic vs anaerobic [10:45] Substrate utilization: fat and carbohydrates [21:45] FatMax [23:40] %VO2max (power or speed) [27:25] %VLamax [34:45] Lactate concentration and rates [40:50]…

Success with software: INSCYD becomes DSV partner for performance diagnostics.
Diagnostics national coach Alexander Törpel (m.) works with fellow coaches Norbert Warnatzsch (l.) and Bernd Berkhahn (r.) at the Magdeburg federal base in Magdeburg. Digitization is also inevitable in the sport of swimming. In the field of sports science, it is now advancing particularly quickly in Germany since Dr. Alexander Törpel was appointed national coach…

3 Things learned during the Workshop: Energy metabolism – and how to apply it
Sebastian Weber reently gave 2-day workshop in Munich about Energy metabolism diagnostics – and how to apply it in training. In attendance were national ski coaches looking to expanding their knowledge. The event was organized by INSCYD partner, the German Ski Association. Do you want to have an inside look at what the national coaches…

[Ultimate Guide] Lactate Testing in Sports – Unlock Athlete Performance
Lactate testing becomes increasingly interesting once you understand the full mechanism behind it. Fortunately, more and more coaches and athletes understand what lactate is NOT: a waste product. Now it’s time to make sure you fully understand what it is!

Webinar: From Training to Victory: Strategic Planning for Championship
Join us for an exclusive webinar where we’ll delve into the secrets behind Team Sportforum‘s success in the ‘Rad-Bundesliga’ opener in Schweigen. Guided by Luke Derksen, Head of Performance, we’ll discuss the strategies and methodologies employed to elevate the team to the status of the best amateur cycling team in Germany. Learn from their real-world experiences…

A high VO2max alone is not good enough!
You can have a VO2max well above 70ml/min/kg, but still perform below expectations. You could even find yourself having a low anaerobic threshold (or FTP) and a low FatMax. That is because a high VO2max alone is not good enough. Here’s an example of a professional cyclist. By Sebastian Weber Swedish cyclist Hannes Bergström Frisk…

Next level metabolic analysis in XC skiing
Just because INSCYD is well accepted in cycling – with partners like Team Jumbo Visma, Movistar and Alpecin-Fenix – doesn’t mean INSCYD is limited to cycling. In fact, the first INSCYD license purchased ever was in swimming – via the French Institute of Sports INSEP. If you are a coach, test lab or federation, who…

Tabata Workout: The King of HIIT Training
Tabata workouts, a type of high-intensity interval training (HIIT), are named after Dr. Izumi Tabata, who compared the effects of these intervals to moderate-intensity endurance training in a scientific publication (1996). The original Tabata workout only takes 4 minutes and boosts your VO2max and anaerobic capacity. Check out our in-depth guide on understanding and improving your VO2max.…

How to Create Highly Effective Interval Training: 4 Steps
Interval training is a highly effective way to improve your athlete’s performance, enabling to train at intensities that are too high to sustain for a long time. To create an effective interval training program, you need to consider the duration and intensity of both the interval and the recovery. In this step-by-step guide, we’ll show…

Double Your Athlete Coaching & Testing Business in 4 Months: Tips from Toll Tollmahawk
One-man coach Toll Tollmahawk more than doubled his athlete coaching and testing business in just 4 months. In this article he shares how he did this, via 3 actionable tips. Toll Tollmahawk My need to better understand it kick started my business Tollmahawk Plus. My goal is to enable all athletes – whether they are professionals, weekend…

Training Zones and Training Zone Builder – part 1
This webinar is about Training Zones and the new INSCYD Training Zone Builder (part 1). Watch the webinar: Agenda timestamps: [02:55] What are training zones and what are they used for: benefits and downsides [11:10] Examples of training zones in different sports and countries [19:40] Translating training zones to real life training: the challenges with…
How carbohydrate combustion determines pacing and fueling
When you want to go fast, you need carbohydrates as a fuel. Once you start running out of carbs, you’ll automatically slow down …

Improve Your Metabolic Profile: Key Metrics & Strategies
So you received your metabolic test report and now wonder what you should work on to improve performance? Here’s how to discover potential room for improvement. We also show how you can calculate your ideal metabolic profile, depending on your goal. Afterwards you know exactly which metrics you should improve by how much. Spread the…

The serial Kona qualifier who trains 12 hour per week
You’ve been told you need to train 15, 18 or even 20 hours a week to qualify for the Ironman World Championships. You’ve been told that you had to want it so badly that you had to devote your entire life to it – let alone your family and professional commitments. And although yes, the task is…

Riding over 1000 km in 24 hours: what does it take?
Christoph Strasser broke the world record for 24h non drafting by riding 1026 km. His INSCYD coach Markus Kinzlbauer shares what it takes to perform such an amazing effort. https://youtu.be/W4ZKmSDhRbA With 6 victories in the Race Across America and a world record in 24h indoor track cycling (941 km), Christoph Strasser was already considered the…

Clock Work Marathon Pacing using fat – and carbohydrate combustion rates
Bernat Xamena after his sub-3h Marathon success Do you want to run a marathon in under three hours? Easy: you only need to run those 42.195 km (26.2 miles) at an average pace of 4:15 per km and smash it in 2 hours and 59 minutes. Of course, it’s not quite that simple: your body…

Running power: how to add physiological meaning to it
With the arrival of affordable running power meters like Stryd, power has become an important metric in running over the past years. Now it’s time to unlock the power of your running power meter. Previously, power was only a number expressing your output. Today INSCYD links this running power to your individual physiology. The result:…

Implement INSCYD data in everyday training, by using AZUM
INSCYD users have a clear advantage over their opponents who still work with conventional performance diagnostics. To make the most out of this (metabolic) data, AZUM developed a platform that enables coaches to implement INSCYD data in everyday training. This makes impractical Excel tables or inaccurate training zones a thing of the past. Here are…


