5 Mistakes You’re Making With Lactate Testing
The 5 most common mistakes in lactate testing and lactate threshold tests. A lactate curve shift to the right does not necessarily mean the athlete improved their aerobic capacity.


The 5 most common mistakes in lactate testing and lactate threshold tests. A lactate curve shift to the right does not necessarily mean the athlete improved their aerobic capacity.
Book a free INSCYD demo: https://inscyd.com/demo
Chapters
00:00 The 5 most common mistakes in lactate testing
00:53 Mistake 1: Body composition and lactate dilution
02:09 Mistake 2: Lactate concepts for males and females
02:55 Mistake 3: Evaluation method and protocol (fixed 4 mmol, DMAX)
04:13 Mistake 4: The physiology that creates a lactate concentration
04:45 The most common mistake: interpreting a right shift
05:42 Mistake 5: Interpreting a left shift of the lactate curve
Sebastian Weber goes through what most people overlook when they interpret a lactate test, a lactate threshold test or a lactate curve.
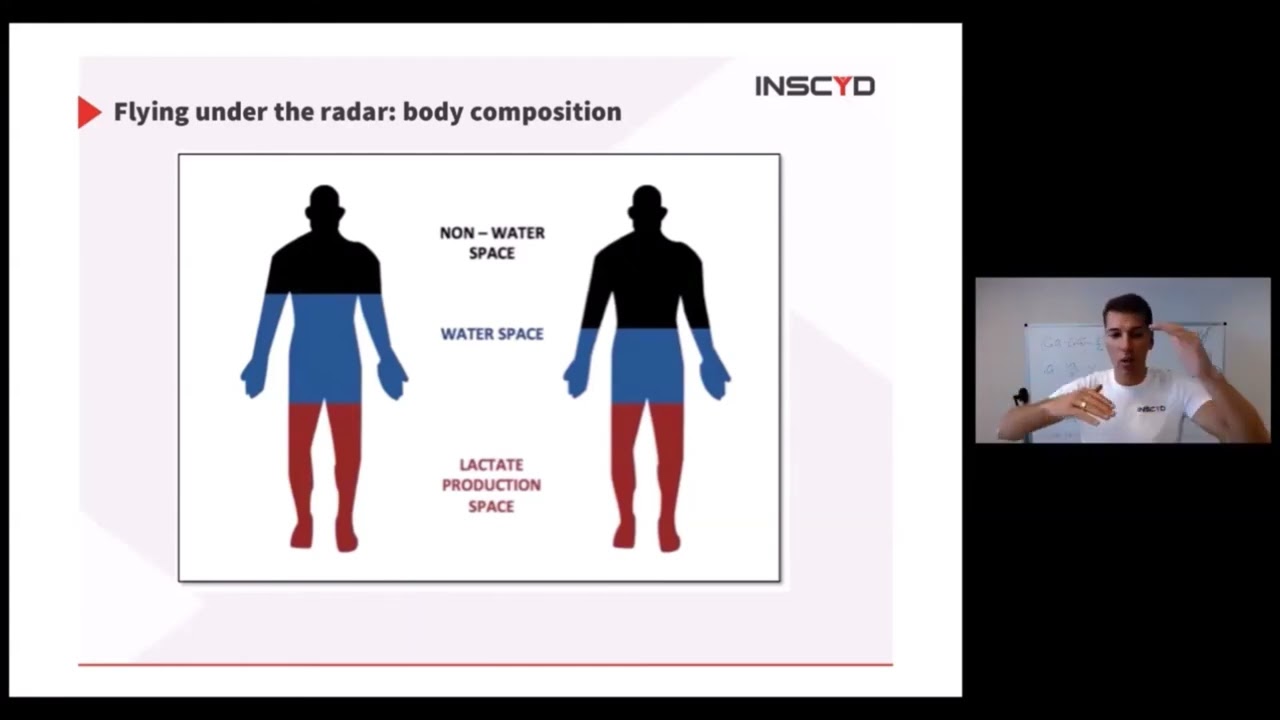
1. Body composition. Lactate dilutes in water. The more lean body mass there is, the more dilution space there is, the lower the lactate concentrations are going to be. That could be interpreted as an increase in performance. However, it is just a changed body composition and not any change of the metabolism.
2. Males and females. Females show a different lactate concentration than males, partly because of different body composition, but partly also because of the phenotypes of the muscles. Concepts that don't account for this provide, especially in females, a wrong training zone and wrong threshold metrics.
3. The evaluation method. The protocol changes the lactate concentration: a shorter step duration leads to a lower lactate concentration for the same intensity. All evaluation methods, fixed 4 mmol, DMAX or modified DMAX, are linked to a specific protocol, so check if yours is actually validated for the protocol you are using.
4. The physiology. The lactate concentration that you measure is the result of a certain lactate production and a certain lactate combustion. A right shift could well just be a decreased lactate production: underfuelling, a change in diet, low glycogen stores, or a reduced glycolytic capacity as an adaptation to training.
5. The left shift. Higher lactate concentrations for the same speed or power can come from increased glycolytic power, which means more ATP production in the glycolysis. This is not necessarily a decreased performance of the athlete.
The physiology behind it, in INSCYD
- Lactate concentration is not only influenced by speed or power, but also by lactate production, lactate clearance, body composition, and economy. https://inscyd.com/for-labs
- Body Composition: https://inscyd.com/metric/body-composition
- Lactate Production Rate and Lactate Oxidation Rate: https://inscyd.com/metric/lactate-production-combustion
- A direct 30-minute constant-load protocol measures MLSS; an incremental lactate test approximates it, in most cases with unknown accuracy. https://inscyd.com/metric/anaerobic-threshold
- INSCYD turns any test protocol into a complete metabolic profile, at gold-standard accuracy. https://inscyd.com
Watch next
- Why a Left or Right Shift in the Lactate Curve Can Mislead You
- 3 Mistakes You're Making with LT1
- Lactate Sampling Tips You Wish You Knew Sooner
- Lactate Clearance Explained
Sebastian Weber is a sport scientist and the founder of INSCYD. He coaches WorldTour cyclists and advises elite federations.
Which of the five do you see most often in the tests you read? Tell us in the comments on YouTube.
So, the 5 most common mistakes in lactate testing. A lactate curve shift to the right. Lower lactate concentration for the same given intensity does not necessarily mean the athlete improved their aerobic capacity. It could well just be a decreased lactate production for whatever reason. Underfuelling, change in diet, low glycogen stores. The lactate curve can shift to the left.
And this is not necessarily a decreased performance of the athlete. However, most people normally never ask how many liters are there. Females show a different lactate concentration. However, most people don't adjust their interpretation, provide wrong training zone, wrong threshold metrics. Most people disregard the fact that the protocol changes the lactate concentration. The first thing which people overlook.
So, the 5 most common mistakes in lactate testing. The first thing which people overlook is body composition. It's quite funny. When you look, for example, at VO2max, it's expressed per kilogram body weight. And at some point, people would ask about the body weight, how many kilograms are there. Lactate uses the same mathematical operation, a simple division, millimoles divided by liters.
However, most people normally never ask how many liters are there. In short, lactate dilutes in water. The more lean body mass there is, the more water there is, the more dilution space there is, the lower the lactate concentrations are going to be. So changes in body composition, more muscle or less fat, most common driver, change the lactate concentration.
Higher muscle mass would lead to lower lactate concentration, potentially, depending on if this muscle is used and how it's used during exercise. Drop in body fat does the same thing and therefore could lead or would lead to lower lactate concentration, which could be interpreted as an increase in performance. However, it's maybe not. It is just a changed body composition and not any change of the metabolism.
Number two, not differentiating lactate profile concepts and lactate concentrations for males and females, partly because of different body composition, but partly also because of the phenotypes of the muscles, how much muscle mass is there and so on. Females show a different lactate concentration than males. However, most people don't adjust their interpretation, their concepts which they use, for example, to get a proxy for a maximum lactate steady state or to derive training zones from lactate tests that don't account for the gender, males and females, and therefore, especially in females, provide wrong training zone, wrong threshold metrics, not taking into account the gender of the athlete.
Number three, not using an evaluation method, meaning fixed 4 mmol, DMAX, modified DMAX, whatsoever concept, so not adapting the interpretation method to the protocol used. Most people disregard the fact that the protocol changes the lactate concentration. Shorter step duration leads to lower lactate concentration for the same given running speed, power output on the bike, swimming speed, so for the same intensity.
Basically because there's less time in an incremental test for lactate to accumulate and to especially show up in the bloodstream, this is where you measure it. So shorter step duration leads to lower lactate concentration, meaning if you have whatever method you use, you need to take into account what protocol you are using.
Not all interpretation methods, especially something like a fixed 4 mmol threshold, is independent of the protocol. All evaluation methods are linked to a specific protocol. So you want to check if the methodology you're using is actually fitted or if it's actually validated for the protocol that you are using.
Mistake number four is based on disregarding the physiology that creates a lactate concentration. The lactate concentration that you measure is not only influenced by the time, the duration of the effort, and by the body composition, because the amount of lactate that is accumulating dilutes in the body. The lactate concentration that you measure is the result of a certain lactate production and a certain lactate combustion.
And disregarding that leads to the most common mistake, which is the interpretation of a right shift of the lactate curve. So the lactate curve going to the right, meaning for the same power or speed, you now have a lower lactate concentration. Interpretation of that as increased aerobic or endurance capacity. Most common mistake.
A lactate curve shift to the right, lower lactate concentration for the same given intensity, does not necessarily mean the athlete improved their aerobic capacity, their VO2max or endurance capacity, whatever you want to, however you want to define that. It could well just be a decreased lactate production for whatever reason, underfuelling, change in diet, low glycogen stores.
And when you control for those factors, it could still well be just a reduced glycolytic capacity of the athlete, for example, as an adaptation to training.
And because of that, number five is the interpretation of a left shift of the lactate curve, meaning higher lactate concentrations for the same given speed or power, interpretation of that as a decreased performance. The lactate curve can shift to the left by increased glycolytic power, increased glycolytic capacity, if you will, which will mean more ATP production in the glycolysis, more power output from anaerobic, more specifically glycolytic energy sources, will shift the lactate curve to the left. And this is not necessarily a decreased performance of the athlete.