
VO₂max
Absolute : 4298 ml/min
Relative : 60.2 ml/min/kg
One test opens the whole athlete: every physiological benchmark ranked against a peer group you choose, every metric plotted across the full intensity range, and every change tracked from one test to the next. Explore it on screen, configure it for your sport, and hand your athlete something they actually understand.
 Marco Rossimale
Test ID#88214
DateMar 12, 2026
TypeLactate
SportTriathlon · Cycling
⇆ Change Test
Marco Rossimale
Test ID#88214
DateMar 12, 2026
TypeLactate
SportTriathlon · Cycling
⇆ Change Test
| Zone | Target | Physiological Conditions | ||
|---|---|---|---|---|
| AT | Energy aerobic | Energy anaerobic | ||
| Fat oxidation | 186 | AT66[%] | aerobic98[%] | anaerobic2[%] |
| Tempo | 226 | AT80[%] | aerobic95[%] | anaerobic5[%] |
| Anaerobic Threshold | 281 | — | aerobic92.1[%] | anaerobic7.9[%] |
| 25% Anaerobic 3' | 318 | AT113[%] | aerobic75[%] | anaerobic25[%] |
| 25% Anaerobic 90" | 352 | AT125[%] | aerobic68[%] | anaerobic32[%] |
| 25% Anaerobic SS | 391 | AT139[%] | aerobic61[%] | anaerobic39[%] |
From Olympic federations and WorldTour teams to remote coaches, HYROX studios, longevity clinics and human performance labs worldwide.
Think about a digital twin of the physiology of your athlete! All physiological performance relevant metrics in one place: from body composition to maximum capacity of each bioenergetic system, from steady state characteristics to training zones which can mimic specific effort duration or training distances.
Absolute : 4298 ml/min
Relative : 60.2 ml/min/kg
VLamax : 0.52 mmol/l/s
Absolute : 281 watt
Relative : 3.94 watt/kg
MFO Absolute : 355 kcal/h
MFO Relative : 4.97 kcal/h/kg
Carbmax : 187 g/h
Absolute : 196 watt
Relative : 2.75 watt/kg
Absolute : 486 g
Relative : 6.81 g/kg
Economy : 12.8 ml/min/W
Power: 340 watt demand: 68.86 ml/min/kg, VO₂ uptake: 53.37 ml/min/kg
Power: 320 watt recovery: 0 mmol/l/min, accumulation: 0.92 mmol/l/min
| Zone | Lower | Target | Upper | Physiological Conditions |
|---|---|---|---|---|
| Recovery | 120watt | 136watt | 148watt | Total energy526kcal/hFat75%Carbohydrates31g/h |
| Base | 177watt | 190watt | 202watt | Total energy728kcal/hFat63%Carbohydrates64g/h |
| Medio | 225watt | 239watt | 253watt | VO₂max74%Carbohydrates128g/hAnaerobic threshold85% |
| FatMax | 172watt | 185watt | 198watt | Total energy710kcal/hFat65%Carbohydrates60g/h |
| Anaerobic Threshold | 262watt | 281watt | 301watt | VO₂max82%Carbohydrates233g/hAnaerobic threshold100% |
Each physiological performance benchmark is ranked against a comparison value. This allows you to immediately interpret the value at one glance to understand which metric offers potential room for improvement.
INSCYD comes with three built in, sport and gender specific comparison groups: recreational, amateur and professional. You can add up to six categories of your own, built around age, event or training level, goals, race demand – whatever your need is.
Every key performance metric can be ranked to comparison data and visualized in the metabolic fingerprint of the athlete.
This chart allows you to understand at one glance which areas allow room for improvement and should be tackled by specific training interventions.
The metabolic fingerprint compares physiological benchmarks with a chosen comparison group.
Choose which datapoints appear on the graph.
Load characteristics show how each physiological metric behaves as a function of power or speed. From aerobic to glycolytic energy supply, oxygen cost to oxygen uptake, substrate utilization, lactate clearance and accumulation rate… all relevant metrics in one dashboard. We call it the heart and soul of metabolic profiling, because it is the center dashboard because it looks inside the athlete at every intensity.
All graphs are interactive – you can zoom and move around areas of interest.
Add up to two x-axes to show different units of interest – such as pace in min:sec/km and km/h in running, min:sec/100m in swimming, or Watt/kg in cycling.
Hover with the mouse on the graph to see the exact values below the graph.
The dark blue line indicates the total metabolic cost (energy cost) as a function of power or speed.
Instead of expressing it in energy (kcal or kJ), it is shown in oxygen equivalents.
The light blue line represents oxygen uptake (VO2).
The difference between these curves indicates how much energy is covered aerobically, while the gap represents anaerobic contribution.
This graph shows lactate production rate (red curve) and maximum lactate oxidation rate (blue curve) as a function of intensity.
The intersection point marks the maximum lactate steady state (MLSS), where production equals oxidation.
Above MLSS, lactate accumulates continuously as production exceeds oxidation.
Below MLSS, lactate can be reused or fat can be used as fuel.
This graph illustrates the net lactate accumulation rate (purple curve) above MLSS.
The grey curve shows the rate at which accumulated lactate can be cleared or oxidized.
This graph shows fat combustion rate (green curve) and carbohydrate combustion rate (red curve) across exercise intensity.
Values are displayed in kcal/h and additionally carbohydrates in g/h.
The green area highlights maximum fat oxidation (MFO ±5%).
The orange area indicates carbohydrate usage between 60–90 g/h.
This graph shows the fractional contribution of aerobic (blue) and anaerobic (red) metabolism.
It represents steady-state conditions, where anaerobic contribution comes from glycolysis only.
This graph shows the proportion of energy derived from fats (green) and carbohydrates (red).
It illustrates how fuel usage shifts with exercise intensity.
Drag a range to zoom. Hover to read the values.
The dark blue line indicates the total metabolic cost (energy cost) as a function of power or speed.
Instead of expressing it in energy (kcal or kJ), it is shown in oxygen equivalents.
The light blue line represents oxygen uptake (VO2).
The difference between these curves indicates how much energy is covered aerobically, while the gap represents anaerobic contribution.
This graph shows lactate production rate (red curve) and maximum lactate oxidation rate (blue curve) as a function of intensity.
The intersection point marks the maximum lactate steady state (MLSS), where production equals oxidation.
Above MLSS, lactate accumulates continuously as production exceeds oxidation.
Below MLSS, lactate can be reused or fat can be used as fuel.
This graph illustrates the net lactate accumulation rate (purple curve) above MLSS.
The grey curve shows the rate at which accumulated lactate can be cleared or oxidized.
This graph shows fat combustion rate (green curve) and carbohydrate combustion rate (red curve) across exercise intensity.
Values are displayed in kcal/h and additionally carbohydrates in g/h.
The green area highlights maximum fat oxidation (MFO ±5%).
The orange area indicates carbohydrate usage between 60–90 g/h.
This graph shows the fractional contribution of aerobic (blue) and anaerobic (red) metabolism.
It represents steady-state conditions, where anaerobic contribution comes from glycolysis only.
This graph shows the proportion of energy derived from fats (green) and carbohydrates (red).
It illustrates how fuel usage shifts with exercise intensity.
Drag a range to zoom. Hover to read the values.
The dark blue line indicates the total metabolic cost (energy cost) as a function of power or speed.
Instead of expressing it in energy (kcal or kJ), it is shown in oxygen equivalents.
The light blue line represents oxygen uptake (VO2).
The difference between these curves indicates how much energy is covered aerobically, while the gap represents anaerobic contribution.
This graph shows lactate production rate (red curve) and maximum lactate oxidation rate (blue curve) as a function of intensity.
The intersection point marks the maximum lactate steady state (MLSS), where production equals oxidation.
Above MLSS, lactate accumulates continuously as production exceeds oxidation.
Below MLSS, lactate can be reused or fat can be used as fuel.
This graph illustrates the net lactate accumulation rate (purple curve) above MLSS.
The grey curve shows the rate at which accumulated lactate can be cleared or oxidized.
This graph shows fat combustion rate (green curve) and carbohydrate combustion rate (red curve) across exercise intensity.
Values are displayed in kcal/h and additionally carbohydrates in g/h.
The green area highlights maximum fat oxidation (MFO ±5%).
The orange area indicates carbohydrate usage between 60–90 g/h.
This graph shows the fractional contribution of aerobic (blue) and anaerobic (red) metabolism.
It represents steady-state conditions, where anaerobic contribution comes from glycolysis only.
This graph shows the proportion of energy derived from fats (green) and carbohydrates (red).
It illustrates how fuel usage shifts with exercise intensity.
Drag a range to zoom. Hover to read the values.
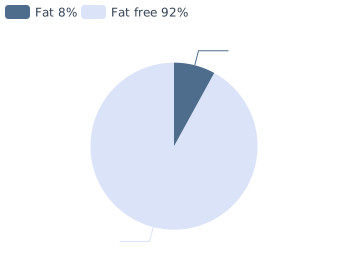
INSCYD calculates a whole body composition – including water and muscle mass – from the fat measurement only.
Muscle mass is crucial to understand the available glycogen storage.
Water mass is undervalued because it affects the so-called lactate dilution space. Most people are familiar with lactate concentration in mmol per Liter. But without understanding the Liter in the equation this number is hard to interpret correctly. INSCYD solves this and thereby makes interpretation of lactate reading independent of body composition.
Overview of body composition and anthropometric data.
It can be difficult to really put physiological performance metrics into perspective. VO₂max is measured in ml/min/kg, VLamax in mmol/l/s and MLSS in power – that makes it hard, if not impossible to really compare the values. Also: a VLamax of 0.5 mmol/l/s in an 80kg athlete and in a 60kg athlete can mean something totally different.
INSCYD solves this for you: by converting all metrics to one and the same unit it becomes possible to finally compare all these metrics and clearly see how much stronger – or weaker – the glycolytic system is compared to the aerobic, at which percentage MLSS sits and much more.
Relative metabolic performance metrics from body composition data.
Make a list of the physiological factors that actually determine performance: fat oxidation, carbohydrate use, economy, recovery, aerodynamics, and so on. Now make a second list: the metrics you actually track in training. If you can’t directly track the things you’re trying to improve, how do you know whether training is moving them in the right direction?
VO₂max, VLamax, FatMax, carbohydrate cost, recovery. Every driver of performance, not just FTP.
Track multiple metrics on one chart, up to three axes side by side, and spot adaptations a single number misses.
See exactly what six weeks of work changed, metric by metric.
Clear, personalized visuals that show athletes their training paying off, in reports that carry your name.
Choose every metric and grouping. Up to three charts per sport, time-scaled or evenly spaced.
Field or lab, power based or lactate based. Same metrics, same chart.
Compare the Metabolic Fingerprint, the metabolic power and of course the steady state characteristic of different tests. This can be either tests from the same athlete – for example before or after a training block. You can also compare different athletes to each other. Or you can compare the current test result against a virtual future self of the athlete – to quantify what performance becomes possible in the future.
| ID | Athlete | Sport | Coach | Test Type | Test Date | VO₂max | VLamax | Weight |
|---|---|---|---|---|---|---|---|---|
| 88214 | Marco Rossi | Cycling | Anna Keller | Lactate | Mar 12, 2026 | 60.2 | 0.52 | 71.4 |
| 87102 | Marco Rossi | Cycling | Anna Keller | Lactate | Jan 27, 2026 | 57.9 | 0.57 | 72.6 |
Percentages for both tests use the amateur · Cycling benchmark.
| ID | Athlete | Sport | Coach | Test Type | Test Date | VO₂max | VLamax | Weight |
|---|---|---|---|---|---|---|---|---|
| 88214 | Marco Rossi | Cycling | Anna Keller | Lactate | Mar 12, 2026 | 60.2 | 0.52 | 71.4 |
| 88390 | Lukas Meier | Cycling | Anna Keller | Lactate | Mar 5, 2026 | 72.0 | 0.35 | 68.0 |
Percentages for both tests use the pro · Cycling benchmark.
| ID | Athlete | Sport | Coach | Test Type | Test Date | VO₂max | VLamax | Weight |
|---|---|---|---|---|---|---|---|---|
| 88214 | Marco Rossi | Cycling | Anna Keller | Lactate | Mar 12, 2026 | 60.2 | 0.52 | 71.4 |
| 88297 | Marco Rossi | Cycling | Anna Keller | Virtual | Mar 12, 2026 | 63.0 | 0.45 | 71.0 |
Percentages for both tests use the amateur · Cycling benchmark.
VO₂max, VLamax, FatMax, thresholds, fuel use and training zones, from a single test in the lab, in the field or fully remote.

