
Training Zone Builder

Build Training Zones Around What You Want to Improve

Using percentages of an “individual” threshold may look personalized, but the same percentage will create very different physiological responses in different athletes.

With the INSCYD Training Zone Builder, you build zones around the physiological system you actually want to improve.

  • Improve FatMax?Build a zone based on fat combustion.
  • Train VO2max?Use %VO2max.
  • Target anaerobic capacity?Build it around VLamax or anaerobic energy contribution.

Train the system, don’t guess it from extrapolated threshold.

Up to 20 zones per template, any sport.
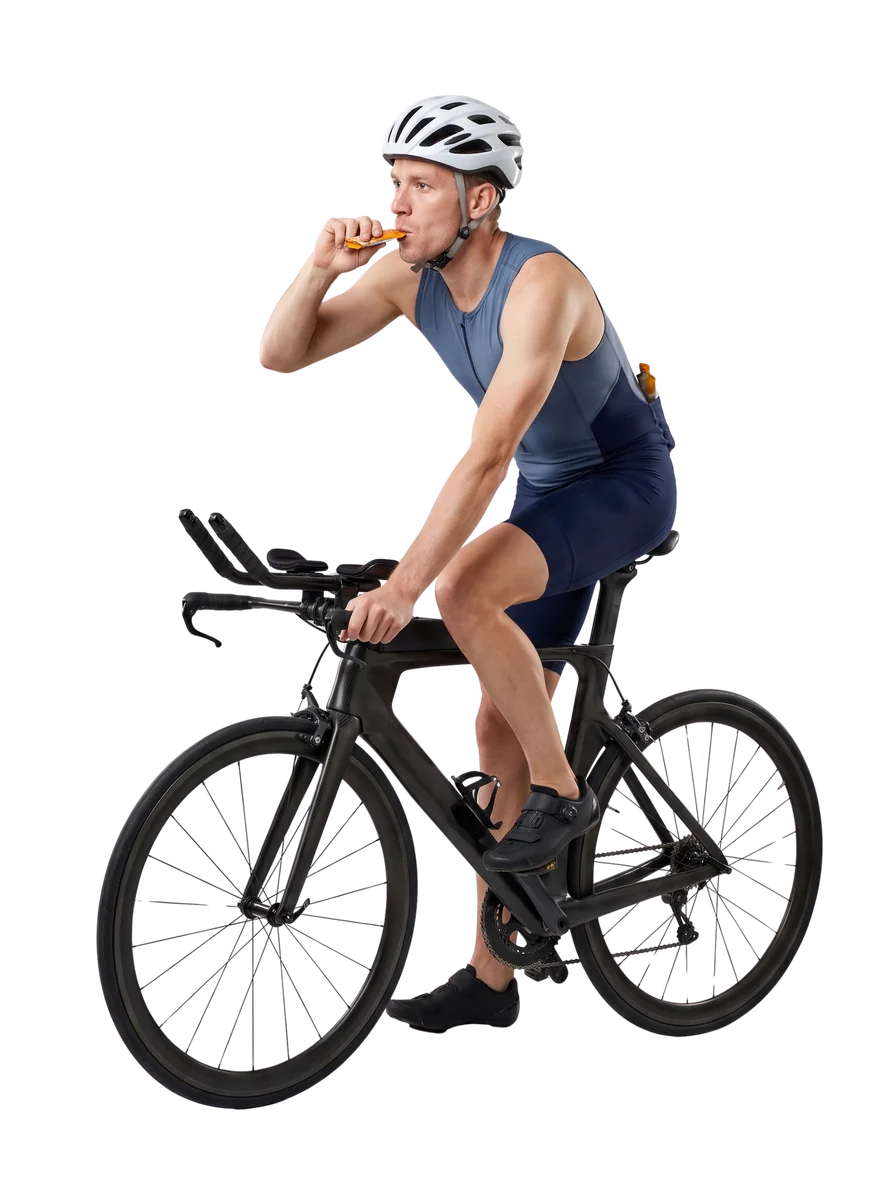
Triathlete riding a time trial bike
Build the zone on
Master metricVO2max% of the power at VO2maxTarget46%
Zone for this athlete147to168watt
Total energy606kcal/hFat58%Carbohydrates60g/h
Demo athlete, anaerobic threshold 234 W. Every athlete on the roster gets their own watts from the same template.
Trusted by the coaches behind the best in sport

From WorldTour physiologists and national federations to coaches building their first squad, worldwide.

The problem with percentages

Same % of threshold. Different training stimulus.

Two athletes can have the same threshold, but very different physiology above and below it.

That means 70% of threshold may be FatMax for one athlete, but not for another. And 120% of threshold may create the right VO2max stimulus for one athlete, but miss it for another.

Instead of guessing from threshold percentages, prescribe training from the physiology you actually want to improve.

Prescribed for both athletes70%of threshold210 W
Both athletes: FTP 300 W
Prescribed target and its rangeZone this athlete actually needs, from FatMax· green when the target lands in it, red when it misses
Athlete A, fat-burning aerobic engineAthlete ARoad · 72 kg · diesel engineVLamax 0.36mmol/l/s
67 to 77%
On target

Lands on FatMax. Fat oxidation at its peak.

Athlete B, glycolytic sprinterAthlete BRoad · 71 kg · glycolytic sprinterVLamax 0.62mmol/l/s
51 to 61%
9 pts too hard

Above FatMax. Fat oxidation is already falling.

50%60%70%80%

% of each athlete’s own threshold

Same percentage doesn’t mean same stimulus. Measure the stimulus.

The INSCYD way

If INSCYD measures it you can build training on it

You have specific goals in mind when you plan a workout. Build training prescriptions on the specific physiological system you are targeting.

Any test, no matter if lab, field or remote, provides the full metabolic profile of the athlete and allows you to create training zones based on any physiological system or metric you want to improve.

Raise VO2max

Intervals that actually reach the ceiling of the aerobic engine. Not 105% of an unrelated threshold.

% of VO2max power
Burn maximum fat

The exact watts or pace where fat oxidation peaks for this athlete. The famous zone 2, done right.

FatMax intensity
Develop or tame VLamax

Glycolytic power, dosed on purpose. Sprint capacity up for track riders, down for Ironman.

% of VLamax
Race at threshold

The classic zone, now computed from the athlete instead of assumed from a formula.

% of anaerobic threshold
Protect the fuel tank

Cap a zone at 60 g of carbs per hour and endurance rides stop ending in a bonk.

Carbohydrates in g/h
Hit a lactate number

Steady state, or after exactly 30 seconds or 200 meters. Your call.

Lactate in mmol/l
The Training Zone Builder

Zones organized the way you need them

Name your zones, choose the sport and anchor metric, select your preferred speed, pace or power unit, and define the target and limits. Clone zones, drag and drop, and organize them exactly the way you want.

Save your zones once and use them across every athlete and every assessment. INSCYD automatically calculates the individual speed, pace or power, together with the relevant physiological metrics, for each athlete.

Build once. Individualize automatically.

This is the actual flow inside INSCYD.

Name
Template name
Sport
Select
  • Swimming - Freestyle
  • Cycling
  • Running
  • Skating
  • Football
  • Triathlon-Running
  • Triathlon-Cycling
  • Swimming – Backstroke
  • Swimming – Butterfly
  • Swimming – Breaststroke
  • Rowing (Ergometer)
  • VQ Cycling
  • Kajak
  • XC-Ski - uphill running
  • Roller Skating
  • Triathlon - Swimming
  • Handcycling
  • Kajak Speed
  • Ice skating
  • Ski - Roller (Treadmill)
  • Running (STRYD)
  • Nordic combined (Treadmill)
  • XC Ski
  • Ski Alpin (Rad)
  • Trail Running
Relates to one Master MetricFraction between two Master Metrics
ZONE 1
Zone color
Name *
Zone 1
Code
1
Ref-Sys *
Select
  • Select all
  • Power (watt)
  • Power (watt/kg)
  • Speed (m/s)
  • Speed (km/h)
  • Speed (mp/h)
  • Pace (min:sec/km)
  • Pace (min:sec/mile)
  • Pace (min:sec/100m)
  • Pace (min:sec/500m)
Master metric *
 
  • Aerobic Power (kcal/h)
  • Aerobic Power (kJ/h)
  • Aerobic Power (Watt)
  • Aerobic Power (Watt/kg)
  • Anaerobic Power (kcal/h)
  • Anaerobic Power (kJ/h)
  • Anaerobic Power (Watt)
  • Anaerobic Power (Watt/kg)
  • Anaerobic Threshold (% of the speed / power at Anaerobic threshold)
  • ASR
  • Carbohydrates (%)
  • Carbohydrates (g/h)
  • Carbohydrates (kcal/h)
  • Energy contribution aerobic (%)
  • Energy contribution anaerobic (%)
  • Fat (%)
  • Fat (g/h)
  • Fat (kcal/h)
  • FatMax (% of the kcal/h at FatMax)
  • FatMax power (%)
  • Fixed lactate concentration 10 (mmol/l)
  • Fixed lactate concentration 2 (mmol/l)
  • Fixed lactate concentration 4 (mmol/l)
  • Fixed lactate concentration 6 (mmol/l)
  • Fixed lactate concentration 8 (mmol/l)
  • Heart rate (bpm)
  • Lactate accumulation rate (mmol/l/min)
  • Lactate clearance rate (mmol/l/min)
  • Lactate concentration (mmol/l)
  • Lactate production rate (mmol/l/min)
  • Lactate shuttling
  • LT1 (%)
  • Max heart rate (%)
  • Max. Lactate clearance (% of the mmol/l/min value of the lack of pyruvate)
  • Maximum Aerobic Power (Watt)
  • Maximum Power (Watt)
  • Minimum Lactate Equivalent (mmol/l/min)
  • Total Energy (kcal/h)
  • VLamax (%)
  • VO2max-power (%)
Target (%) *
Lower (%) *
Upper (%) *
Additional ...
None
  • None
  • distance (m)
  • time (s)
Value ()
+ Add zone
Saved · live in the athlete performance center
Sprint squadTrack cycling
8 zonesClone
EnduranceRoad and gravel
6 zonesClone
Juniors, femaleDevelopment group
5 zonesClone

Saved once. Every athlete on the roster gets their own watts, pace or speed from it, and so does every new assessment.

Output metrics

Build a zone. See what it means physiologically.

Defining a zone is one thing. Understanding what actually happens inside it is another.

How much carbohydrate does an athlete burn at FatMax? What are the expected lactate levels at 90% VO2max? With multiple physiological systems constantly interacting, a simple intensity range only tells part of the story.

INSCYD shows you the physiology behind every zone, so you know not only where an athlete should train, but what that training actually means metabolically.

ZoneLowerTargetUpperPhysiological conditions
RecoveryRecLower100wattTarget113wattUpper123wattTotal energy436kcal/hFat71%Lactate cl. rate0.58mmol/l/min
BaseBasLower147wattTarget158wattUpper168wattTotal energy606kcal/hFat58%Carbohydrates60g/h
FatMaxFatLower143wattTarget154wattUpper165wattFat60%Fat37g/hFatMax98%
Anaerobic ThresholdATLower218wattTarget234wattUpper251wattVO2max72%Lactate con.4.0mmol/lCarbohydrates204g/h
Duration and distance

Some zones depend on time. Account for it.

High-intensity zones are rarely just about intensity. They are about intensity and duration.

The same power or speed can create very different physiological responses depending on how long it is sustained. Lactate accumulates over time. VO2 rises. The contribution of aerobic and anaerobic energy changes.

INSCYD lets you account for this when building a zone. Target a specific lactate concentration after a race-specific distance? A certain aerobic or anaerobic energy contribution after a 3-minute interval?

Define the physiological target and the duration or distance. INSCYD calculates the individual speed, pace or power required to get there.

Relates to one Master MetricFraction between two Master Metrics
ZONE 1
Zone color
Name *
Race pace 2 km
Code
R2K
Ref-Sys *
Power (watt)
Master metric *
Lactate concentration (mmol/l)
Target (mmol/l) *
4.0
Lower *
3.8
Upper *
4.2
Additional ...
distance (m)
  • None
  • distance (m)
  • time (s)
Value ()
5000
ZoneLowerTargetUpperPhysiological conditions
Race pace 2 kmR2KLower231wattTarget241wattUpper251wattLactate concentration (mmol/l)4.0mmol/ldistance (m)5000set by you
How it works

Where every number comes from: one test.

Every INSCYD test, in the lab, in the field or fully remote, is sufficient to provide the athlete’s complete metabolic profile. This metabolic profile is used to calculate the individual speed, power and physiological values of all the sets of zones you have created.

1

Test the athlete

Any INSCYD test works: lab, field, or fully remote. The result is the complete metabolic profile: VO2max, VLamax, FatMax, anaerobic threshold and more.

Any test, any sport
2

Speed, power physiological values get calculated

Every active template is applied to that profile. Individual watts, paces and output metrics per athlete, not one table for the whole squad.

Your templates
3

Retest, and the values will be updated

Fitness changes, zones follow. After every new test the whole system recalculates itself. No spreadsheets, no manual updates, ever.

Zero manual work

Your athletes are individuals.
Their zones should be too.

“We’ve built and run coaching businesses ourselves. And still do. We built INSCYD because we learned the hard way: training by FTP or critical power alone doesn’t cut it.”

Sebastian Weber · Founder, INSCYD · Coach to world champions in 5 sports Book a demo
Every metric that matters

One assessment. The complete picture of your athlete’s physiology.

VO₂max, VLamax, FatMax, thresholds, fuel use and training zones, from a single test in the lab, in the field or fully remote.