Why a Left or Right Shift in the Lactate Curve Can Mislead You
Incremental lactate test protocol can make or break a cyclist’s season. In this breakdown of lactate testing cycling, sports-scientist Sebastian Weber shows why a simple left- or right-shift of the lactate curve often misleads coaches, and how to read VO₂2max vs VLamax to tailor fueling and

Incremental lactate test protocol can make or break a cyclist’s season. In this breakdown of lactate testing cycling, sports-scientist Sebastian Weber shows why a simple left- or right-shift of the lactate curve often misleads coaches—and how to read VO₂2max vs VLamax to tailor fueling and sprint power.
⏱️ Chapters 0:00 Intro & common testing mistakes 1:32 Classic lactate profile setup 3:46 Left vs right shift myths 6:12 VO2max, VLamax & anaerobic capacity 8:31 Carb burn-rate & fueling strategy from lactate test 10:53 The algorithm that deciphers production vs combustion 12:35 Key training takeaways & next steps
Key learnings
- Why a “better” curve can mean worse sprint power
- How to separate lactate production vs combustion for real progress
- Converting data into carbohydrate burn-rate to nail race-day nutrition
📌 Resources: 💡 Related Article & Studies 👉
https://bit.ly/lactate-cycling 💻 Turn conventional lactate tests into a complete 360° Athletic Performance Assessment - https://inscyd.com/functions/lactate-testing
📺 Watch next 👉 https://bit.ly/physiology-education 📺 Watch training insights from top coaches and athletes 👉 https://bit.ly/training-insights 💻 Book a Free Demo 👉 https://inscyd.com/demo 🔔 Don't miss another videos 👉 https://bit.ly/43MK9bP 🌐 Visit our website 👉 https://inscyd.com/ 📸 Follow us on Instagram 👉 https://bit.ly/3Y5ZQK6 👍 Like us on Facebook 👉 https://bit.ly/3Ybwbz9 🔗 Connect with us on LinkedIn 👉 https://bit.ly/3rOsfbn
📌 Subscribe for weekly deep-dive science that converts lab numbers into podium results!
It is a result of a higher production or lower production and a higher or lower combustion or both increase and the curve can stay the same. The most race decisive moment actually if you think about it the most race decisive moment in cycling require now that you know that can you actually look your athlete in the eye uh doing a retest and say hey here's your result and look you improved. So what is the solution to that?
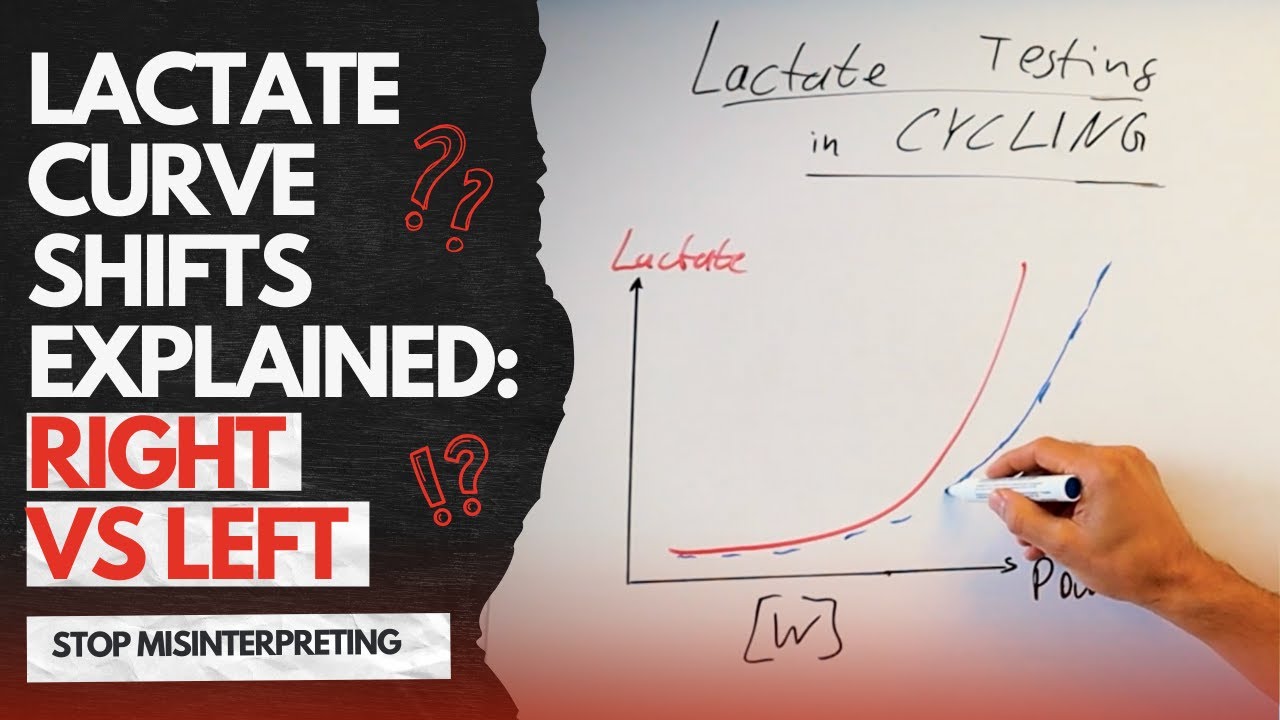
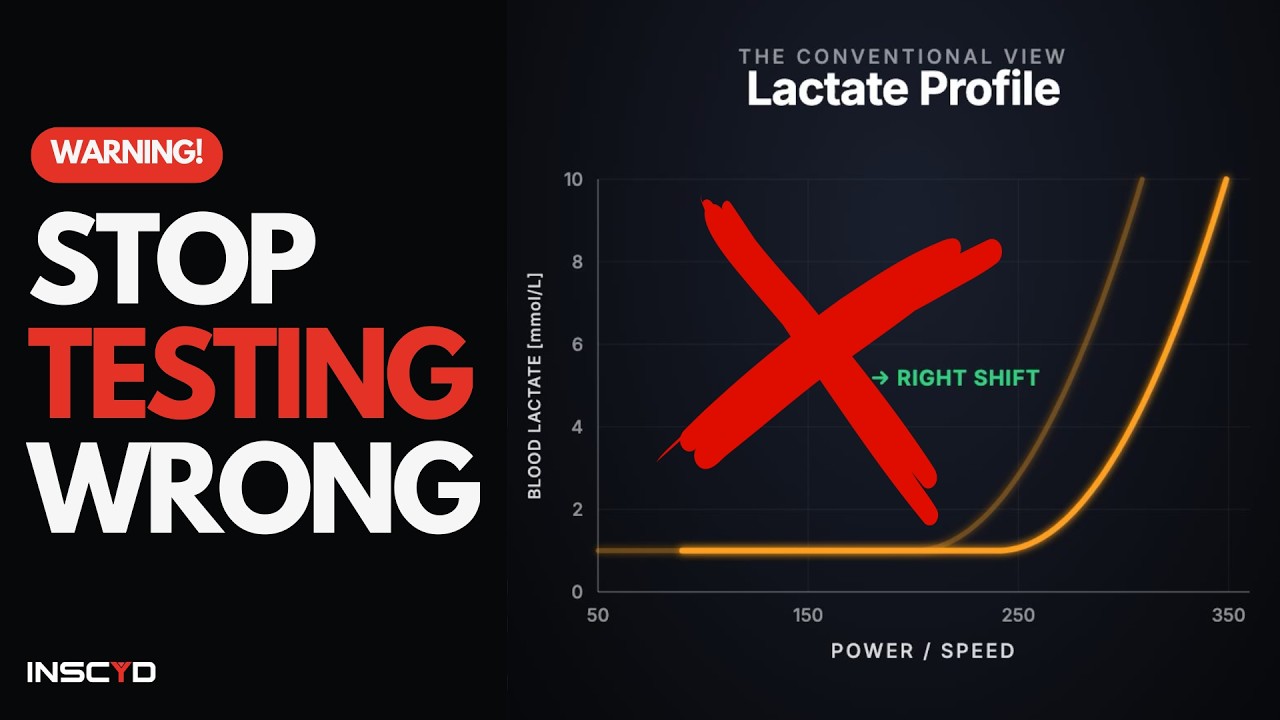
So let us first look what is normally done still going back to the late '7s early 80s of the last century is doing some kind of lactate profile curve where you would plot the power output in case of cycling on the x-axis and the measured lactate concentration on the y-axis. how this data is normally derived. A typical incremental test where the load increases in a stepwise manner starting from 100 watts or 120 watts or whatsoever and increase every 3, four, five nowadays sometimes 8 minutes um by 20 watts, 40 watts, 50 watts depending on the protocol. not here today to argue about the protocol and that you know shorter step durations uh create right shift of lactate lactate curves and longer step duration create a left shift curve that's not what we're going to talk about let's assume you have your protocol you always do the same protocol right you got your setup you're happy with so we're not going to argue about the methodology or what to do better or you know these little nuances no what we're going to talk about today are some fundamental mentals about interpreting the lactate curve especially a shift of the lactate curve in a test retest scenario. So we are going to talk about what may cause the lactate profile curve as we see one here to shift to the left or to shift to the right or to change it shape and what does it actually mean for a practical application in training and racing in a cyclist.
So when doing lactate testing in cyclist, let's take a step back again besides the methodology that you're using and let's ask ourselves, hey, what does an athlete actually want from this test? Okay, so what comes to mind? Benchmarking.
An athlete wants to understand did I improve compared to last year or to the last test to the previous training period. Did the last months of work that I put in, of scarce time that, you know, I shave off my daily busy schedule, did that result in the progress that I wanted to see? And the thing that most people do for that is looking to the lactate curve and see if it shifted to the right.
And I'm going to draw one here in a second. Okay. Now, let's ask ourselves, is that re how relevant is that really to performance in cycling races, different cycling races?
How important is that for gravel races or grandfondos? You could argue that for those kind of races, for a recreational amateur athlete, something like substrate utilization, you know, carbohydrate combustion rate, fat combustion rate, sparing glycogen is far more important than a lactate concentration. So this information by itself is not necessarily inherently visible here in this lactate profile curve.
If you look to some other subset of cyclist, let's say a crit racer, a road racer, a sprinter, you would argue, well okay, what else is important to them? Well, obviously sprint power, anorobic power, high intense power output, right? For short efforts, that's also not in here, right?
This is the mon endurance kind of test. So unfortunately this is where this test falls short. Now you can argue okay okay but nowadays hey we have power meters we do powderation curves right we test maximum power output over 1 minute and 2 minutes or 30 seconds and 6 minutes 20 minutes whatever and then we get a powderation curve and then we can understand actually did the power over 1 minute or 30 seconds in the short time t time ranges did it go up and therefore did anorobic performance go up good thinking but it falls a little bit short because this just tells tells you that the power went up.
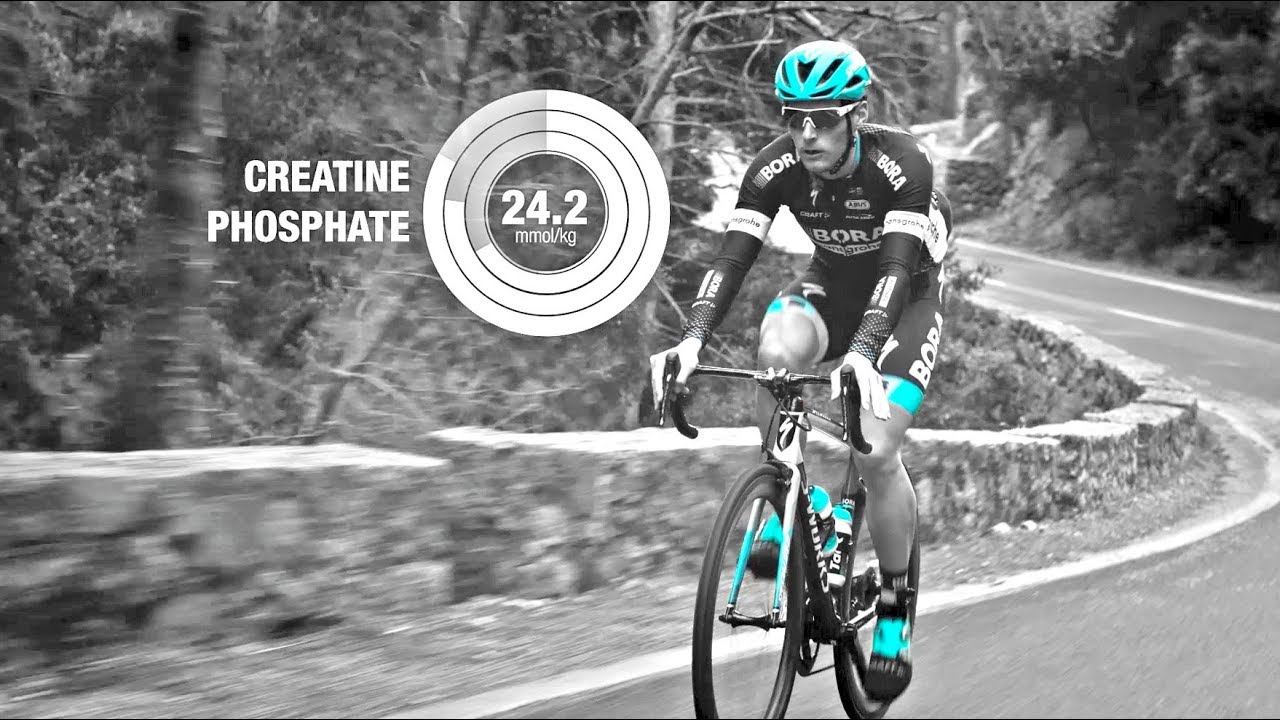
For example, in a one minute effort is approximately already 40 50% aerobic. So when you have a higher power output, it could be that the anorobic system improved. Uh it could also be that you know the aerobic system improved and then the anorobic system is partly creating phosphate capacity and partly it's glycolysis.
So breakdown of glycogen or glucose to lactate. So just looking at the power doesn't tell you anything about that. And if it's better lactate production, if it's better glycolytic performance, is it really that or is it better buffering capacity?
Was the athlete able to handle the acidosis better because that, you know, could lead to higher lactic concentration. So long story short, without going into a rabbit hole, the lactic curve doesn't tell you that. And unfortunately, critical power curve tells you, yeah, the power output is higher, but it does not necessiological reasons for that. and therefore also doesn't tell you exactly how your training actually work.
We're going to come to that. Okay. So, we miss out on substrate utilization or the fueling matrix with a lactate curve.
We miss out on the anorobic part with a conventional lactate curve and I just explained why powderation curves you know seems to offer an alternative but actually don't because they don't contain physological information. Okay, that's the two first two aspects where lactate profile testing can fall short. The third one is the interpretation of the left and right shift.
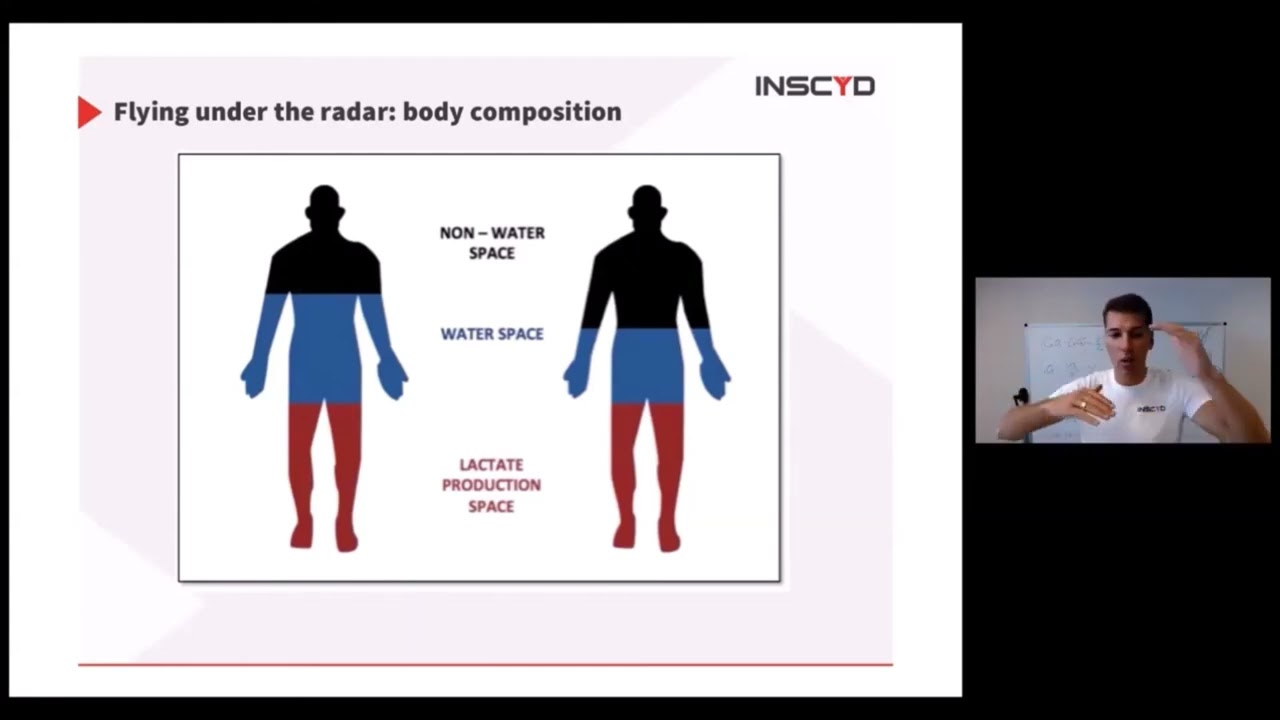
Okay, let's take a step back and look at this lactate profile. The lactate concentration how you actually get to that concentration and the concentration that you measure. Leave alone that's the concentration and that's millip per liters and you need to know the body composition.
We have a whole article about that. Leave that alone. In the current situation of an athlete giving a certain body composition, what creates the lactate concentration is the lactate production.
Right? So obviously somebody exercise, exercise intensity goes up, therefore more lactate is produced. Therefore concentration gets higher.
But on the other hand, there's also a lactate combustion. Lactate is combusted in the aerobic metabolis. And these two metabolic pathways, the combustion and the production happen in parallel.
So the concentration that you measure is the result of both. It is a result of a higher production or lower production and higher or lower combustion. Okay?
And now when you see a curve for example shifted to the right, normally most people would jump up and say, "Oh, great. You know, now we have an improved performance because we can see we have for the same power output a lower lactate concentration or for the same lactate concentration a lower power output." And honestly, I made this mistake myself. I was testing professional cyclists back in the days and did the same thing.
But people came back to me and say, "Hey, Sebastian, something is not clicking here because every time I have a so to speak better lactate curve, I raise worse and vice versa." And what is not so commonly understood is that what because of what I just explained the concentration is a result of the production of the combustion is that when you actually increase the production because you have a better anorobic system your body is able to produce more lactate as a result of a better anorobic slash more precisely glycolic capacity the curve will shift to the left. So let me let me rephrase that. If an athlete has the same body composition, the same aerobic capacity, the same V2 max, everything is the same, but the athlete increases their sprint power in terms of increase their glycolytic power being able to produce more energy, more power in the glycolytic system by breaking down glucose or glycogen to produce lactate.
The curve will shift to the left. And classically this will be interpreted as oh your endurance your performance got worse because we see a left shift. No not necessarily the case.
It's just that this athlete became a better sprinter which can be very helpful in some races. And then the opposite is of course also true. When you see let's say first test the red one retest after a certain time the blue curve you see a right shift of the curve.
Yeah we can say okay we now have a lower lactate concentration for the same power. But is the performance actually better? Not necessarily.
Because this could just be a decrease, a loss in anorobic capacity, a loss in glycolytic energy production. And again, less likely energy production means lower VMX means lower lactate production at every step of your incremental test. Lower lactate production means lower concentration.
And this is really a huge problem in testing the lactate profiles in cyclists because think about it. If you would test a marathon runner, there's not so much anorobic energy contribution needed. So if you see a right shift of the lactate curve, you could at least argue, yeah, I don't know exactly if the curve shifted to the right because the guy got a better capacity or a decreased glycolytic capacity, but at the end I don't care so much.
I mean, it would be nice to know, but I don't care so much because he doesn't need glysic energy anyway. But think about it. In many cycling events, when it comes to attacking, sprinting, bridging the gap, doing the breakaway, so on and so forth, the most race decisive moment actually, if you think about it, the most race decisive moment in cycling require high power output for a short amount of time.
So high anorobic energy contribution and a right shift of the curve can mean that the anorobic system decreased in its capacity or performance. And so now to be honest you have to say okay now to be fair we don't know exactly when we look at a left or right shifted curve what does this mean? And therefore you would argue hm okay now knowing that and I will link here in the video some data some experimental data some science some scientific uh literature that proves what I'm saying here now that you know that can you actually look your athlete in the eye uh doing a retest and say hey here's your result and look you improved when you know maybe actually the athlete did not improve.
So what is the solution to that? The solution to that again going back for to myself. I had the same issue more than 20 years ago was developing an algorithm that is able to read to understand the actual lactate combustion and the actual lactate production that creates this curve. to decipher from the lactate concentration decipher what was the production combustion and therefore be able to understand okay did it go left or right actually because of a better aerobic capacity or a better anorobic capacity or what is also what I didn't even mention is the curve can almost look the same this of measurement because both system you know decrease their performance lower anorobic performance lower eerobic performance or both increase and the curve can stay the same and by having an algorithm which is able to decipher what is behind this curve you can now see exactly how did the aerobic system develop how did the V2 max develop how did the VA max develop how did the anorobic system develop okay and now on top of that to finish where I started what I just mentioned is we are able with this algorithm to understand what is the lactate production that creates a lactate curve now going a little bit Back to biochemistry, a lactate is produced only out of glycogen or glucose.
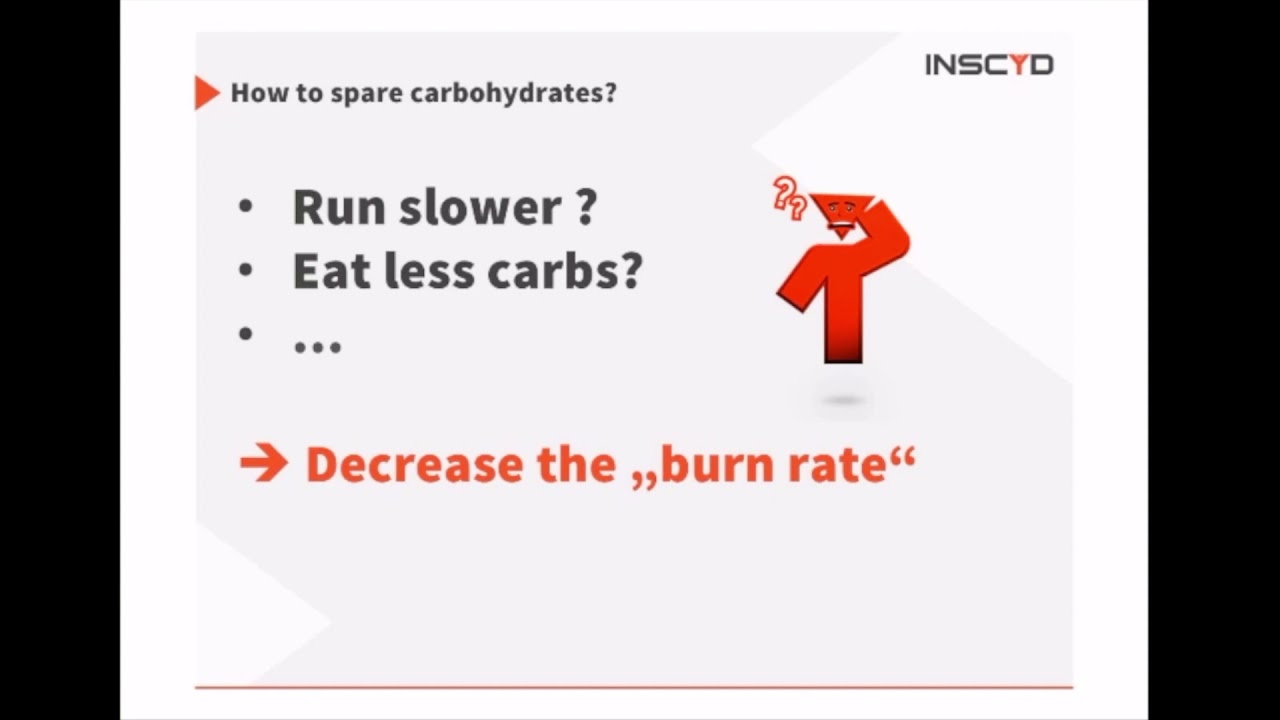
So that means when you are able to see and you're able to decipher what is the lactate production rate, so lactate per minute that is produced, you can calculate very very easily how much sugar, how much carbohydrate, how much glycogen or glucose was needed to produce this amount of lactate. And therefore you now have a glycogen or glucose utilization rate. You have a burn rate.
You can understand how much carbohydrates the athlete burns at every power output that you want. And that is very powerful obviously because that helps you with fueling and everything your gravel racer and grand fun racer wants. And when you know the total power output and you understand how much of this power comes from carbohydrates, how much is covered by burning carbohydrates, the remaining is coming from fat.
So you also understand how much fat is burned. So what I'm telling you here is from a simple incremental lactate test you can decipher the actual lactate production combustion and you can therefore decipher how much of the left or right of the curve comes from an increased aerobic capacity or a decreased glycolytic capacity or vice versa. So you understand v2 max all these things but you can also understand substrate utilization from that and that has been proven pretty powerful.
If you want to know know more about that, read the article in the link. We have all the scientific papers in there. If you say, "Oh, that sounds a little bit too good to be true, read the literature.
This is validated in peer-reviewed science. What I'm telling you, it is steeped in peer-reviewed science and it's no rocket science." Read the literature if you're interested and find out more. Thank you. [Music] Hey, hey, hey. [Music] [Applause] Hey,





![[Tutorial] Training Zone Builder Update](https://cdn.prod.website-files.com/69fb420749df096c7fb865ef/69fdf1e0d26c1f6fe0d4c945_maxresdefault.jpeg)



![[Tutorial] Virtual Test & Performance Projection: Compare Training Outcomes in INSCYD](https://cdn.prod.website-files.com/69fb420749df096c7fb865ef/69fdf1e2a6495029773d8211_maxresdefault.jpeg)


![Create Training Plans Like Top Coaches [5 Steps]](https://cdn.prod.website-files.com/69fb420749df096c7fb865ef/69fdf1e491172a8381d183ad_maxresdefault.jpeg)