Custom PDF reports

The Report you always wanted to hand out to your clients.

Run a test, make a few clicks and then hand your client something professional, in person or by email. Branded with your logo and your colors, your personal comments, individual training zones and much more. Say goodbye to endless fiddling with graphs or generic medical reports.

Trusted by the best in sport, and far beyond it

From Olympic federations and WorldTour teams to remote coaches, HYROX studios, longevity clinics and human performance labs worldwide.

One test, multiple products

Upsell on the spot. More revenue. Zero additional cost.

From the same short and simple INSCYD test, you can create a full metabolic profile, or a simpler, basic report. This allows you to offer different service tiers, such as Basic, Advanced and Premium. And because they all come from the same test, you can upsell clients on the spot without any additional testing.

A client wants more insights? Simply upgrade the report. Within seconds, you can turn the same assessment into a more comprehensive, higher-value service, without additional testing, equipment or operational costs. That means more revenue from the same test, with virtually no additional cost to deliver the higher-tier service.

One test. Multiple service tiers. More revenue per client.

Unlimited templatesDifferent depth, different priceReprint on the spotNo extra testing

Same testField, lab or remote
Different service tiers
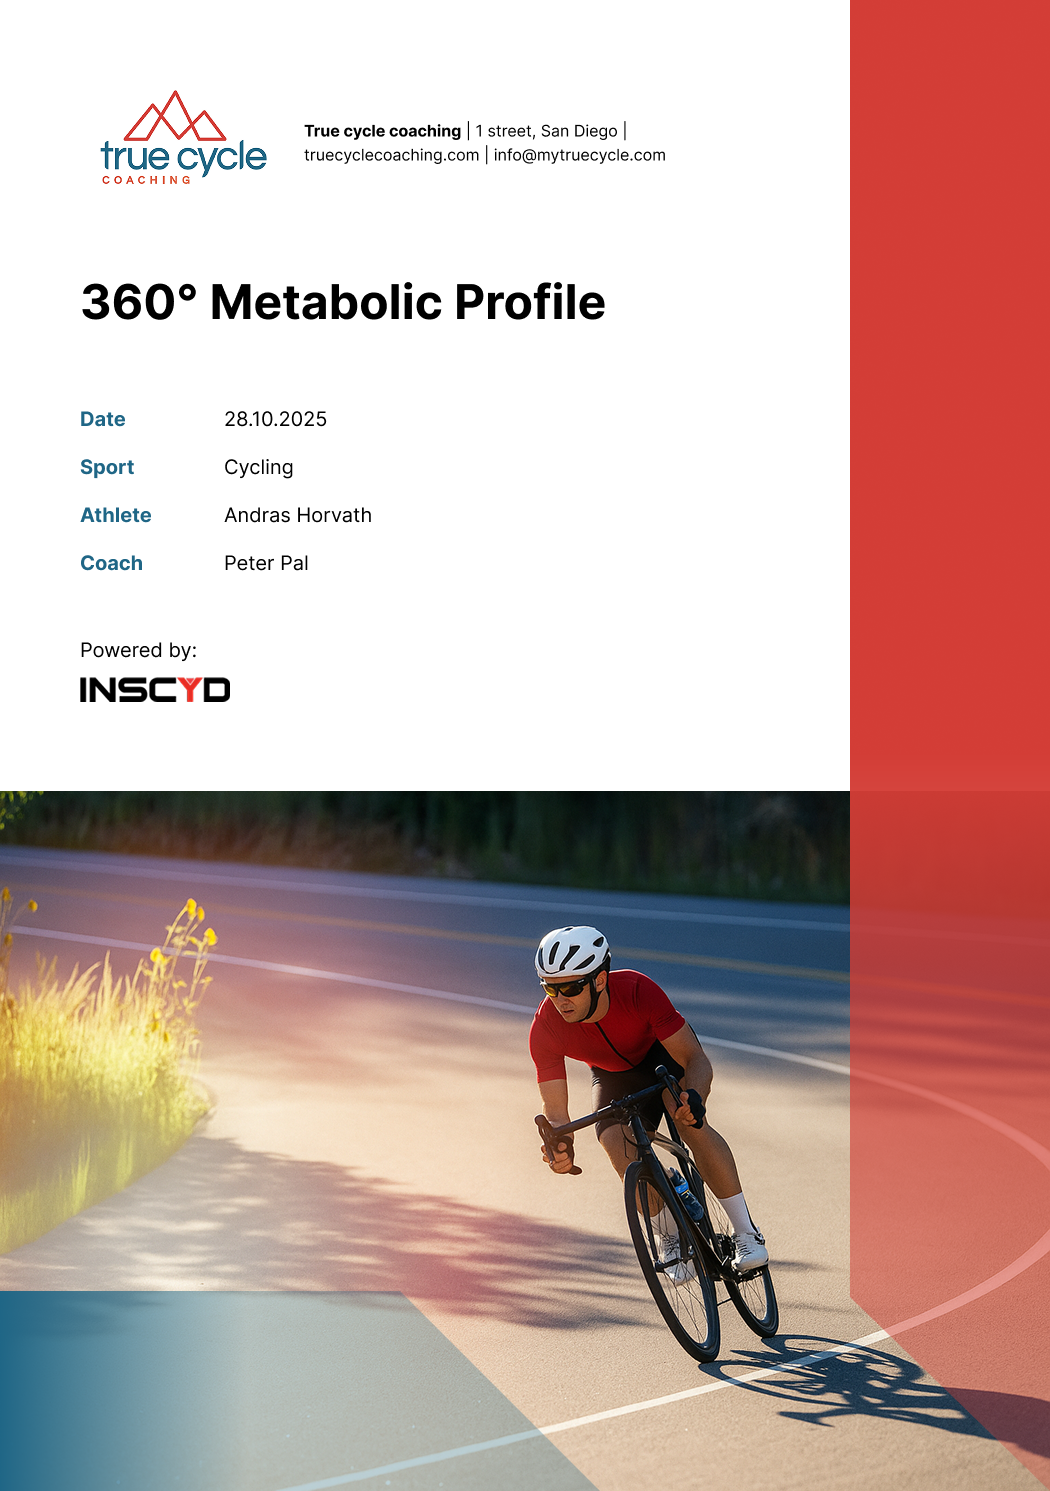
  • Branded cover page
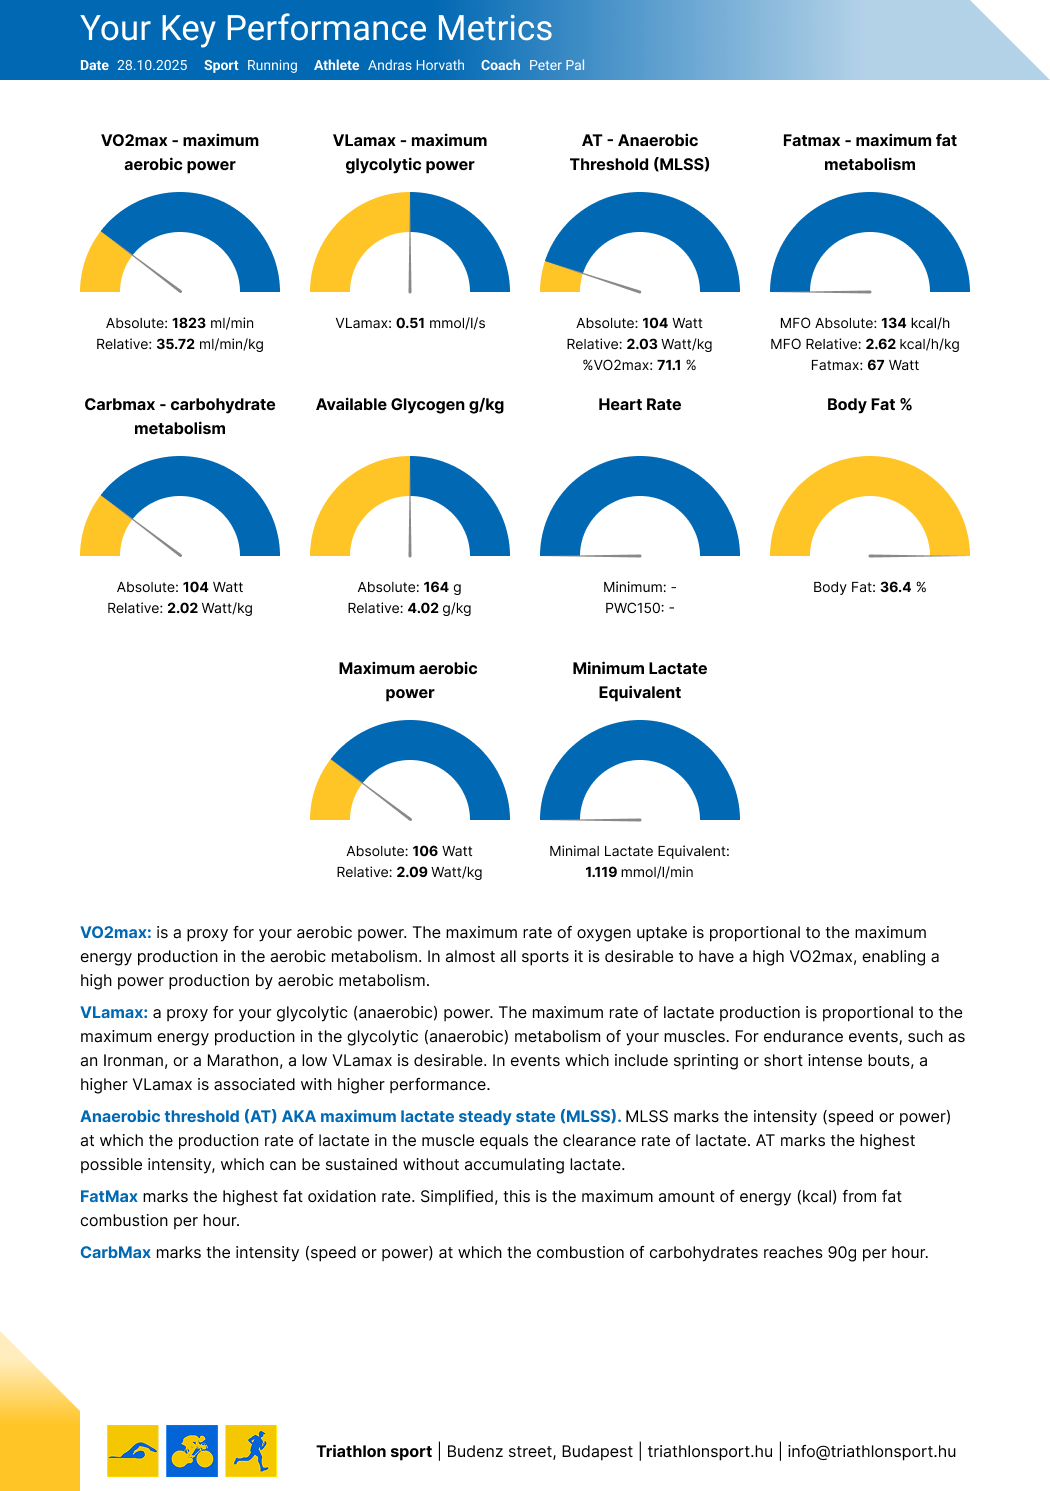
  • Key metrics: VO₂max, VLamax, thresholds
  • Training zones
  • Short interpretation
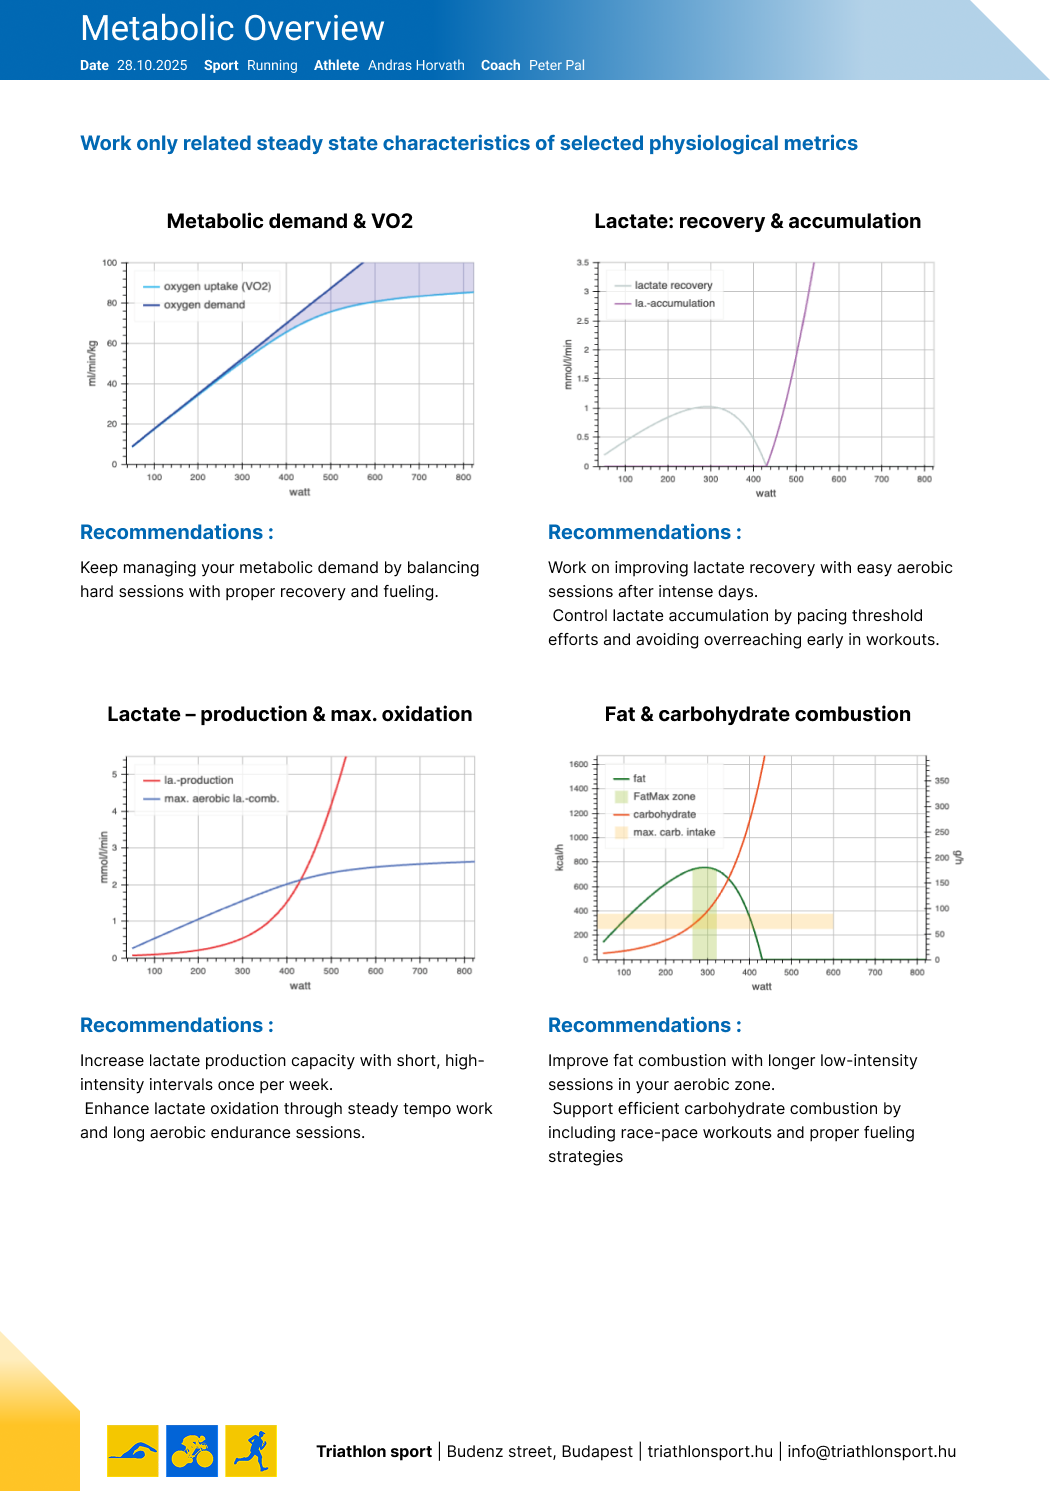
  • Every graph: FatMax, fuel use, lactate
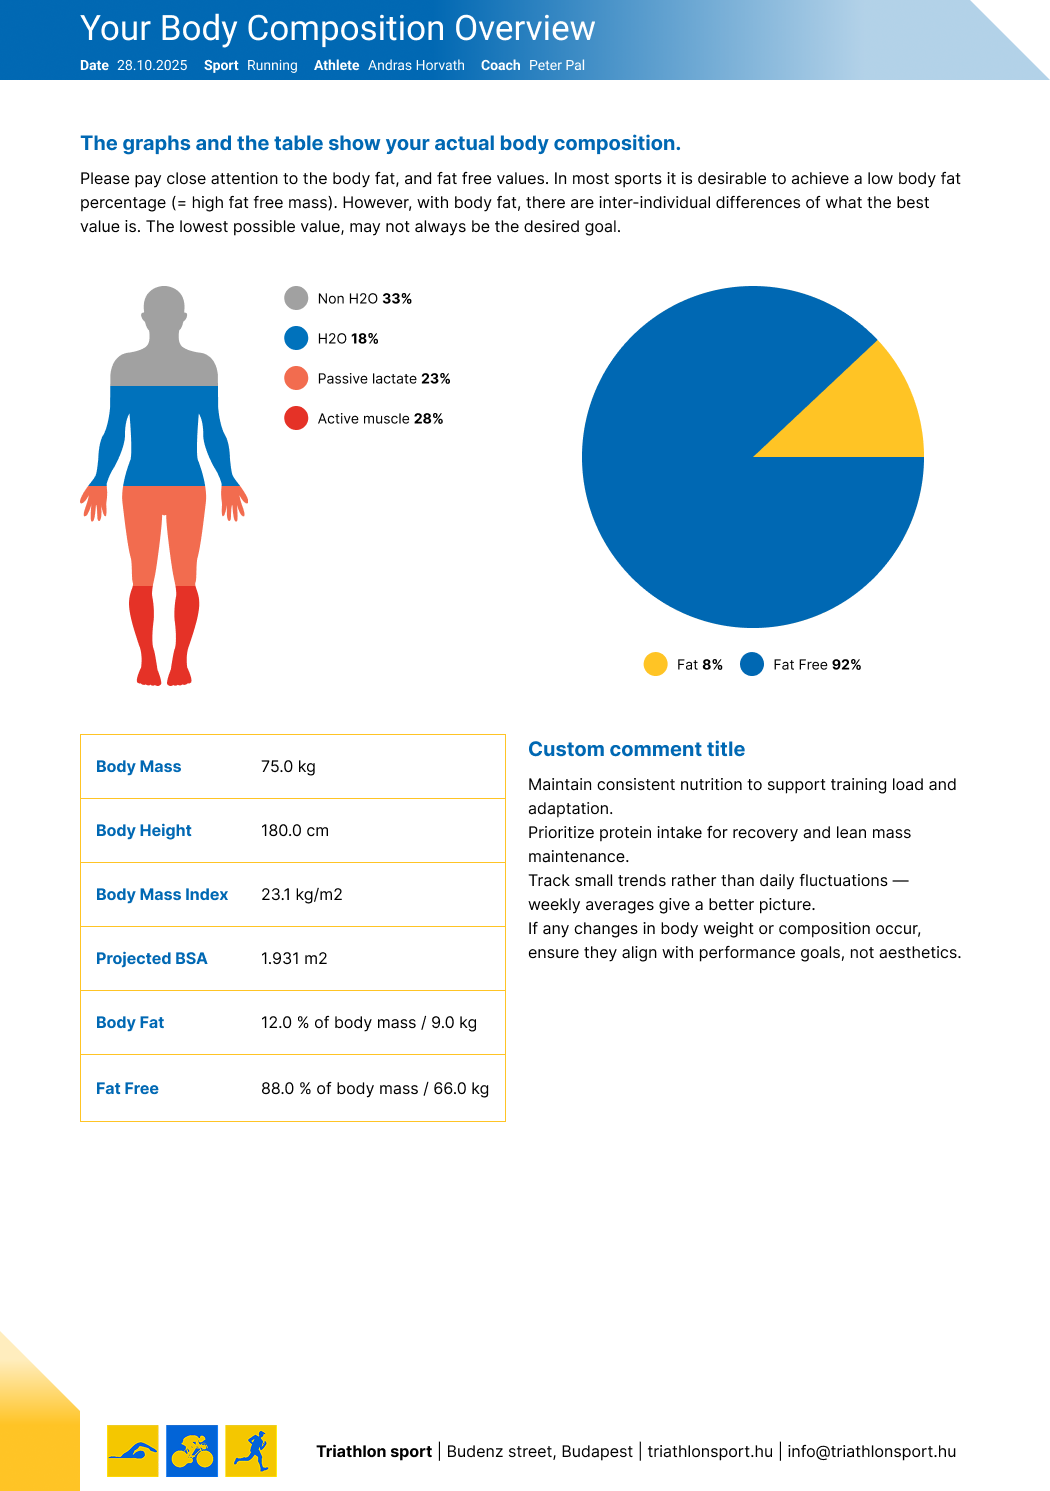
  • Body composition pages
  • Detailed training recommendations
  • Your coaching insight pages
No additional testing, equipment or operational cost.
Automatic branding

Upload your logo. The rest feels like magic.

INSCYD extracts your brand colors instantly from your logo. Every metric, chart accent and page element adapts, including sport-specific cover pages. Want different colors? Change them anytime. No design skills needed: a report perfectly branded to your business.

Primary and secondary colorExtracted from your logoSport-specific coversAdjust or swap anytime

This is a live demo. Pick a palette, choose your own colors, or upload your logo on the left.

Pick your colors
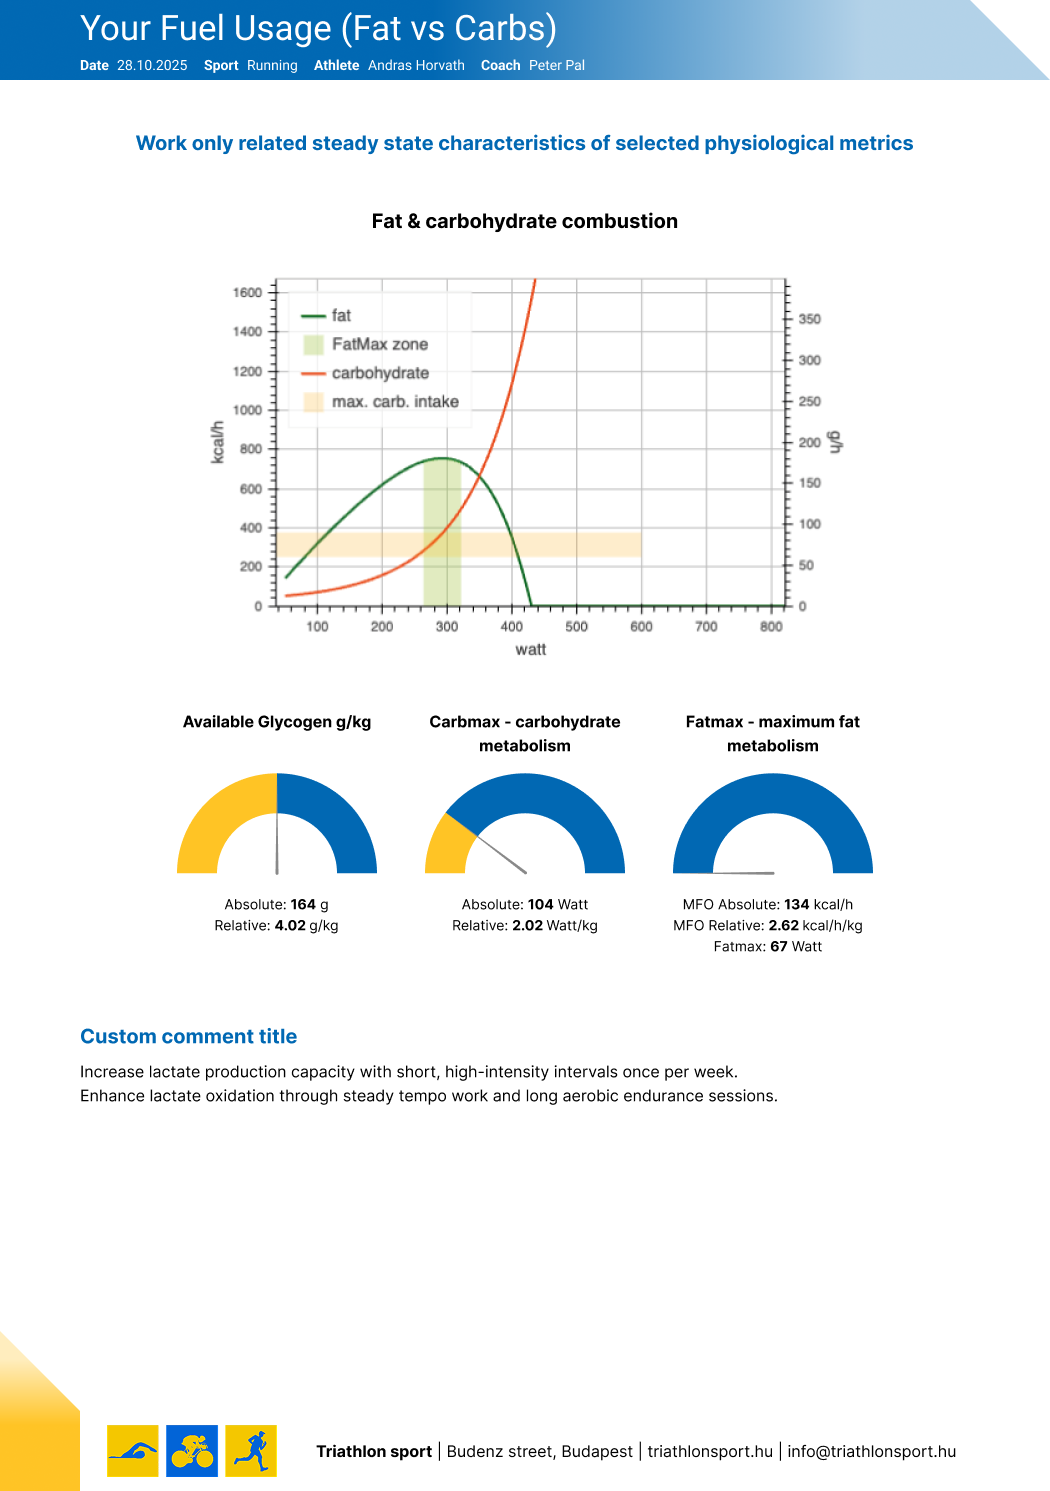
Your Substrate Usage (Fat vs. Carbs)Date 14.07.2026Sport CyclingAthlete M. RossiCoach A. Keller
Available Glycogen
377 g5.25 g/kg
Carbmax
214 Watt2.99 Watt/kg
FatMax
472 kcal/h6.58 kcal/h/kg · 187 Watt
Fat & carbohydrate combustion

Every metric recolors itself. The graphs keep their product colors. Click the title to write your own.

Outline5 pages
Cover
Metabolic profile
Training zones
Fat combustion
Lactate curve
Summary
Saved as your template
Body compositionMeta chart · portrait
FatMaxMeter chart · portrait
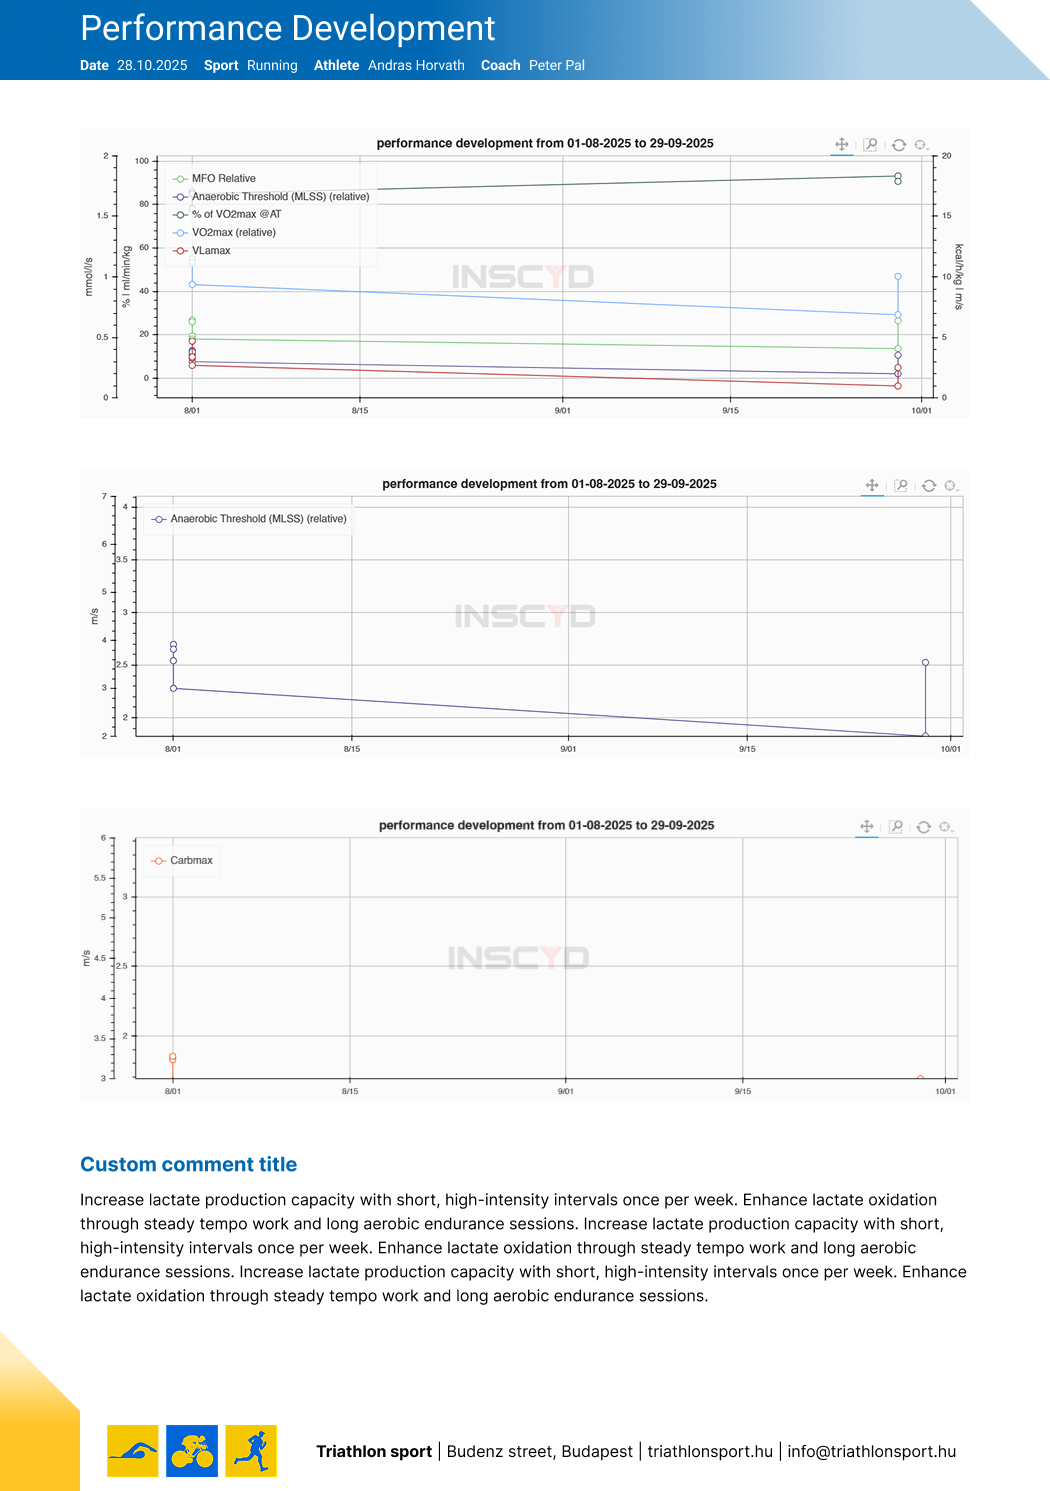
Lactate accumulationLine graph · landscape
Fat combustionLine graph · portrait
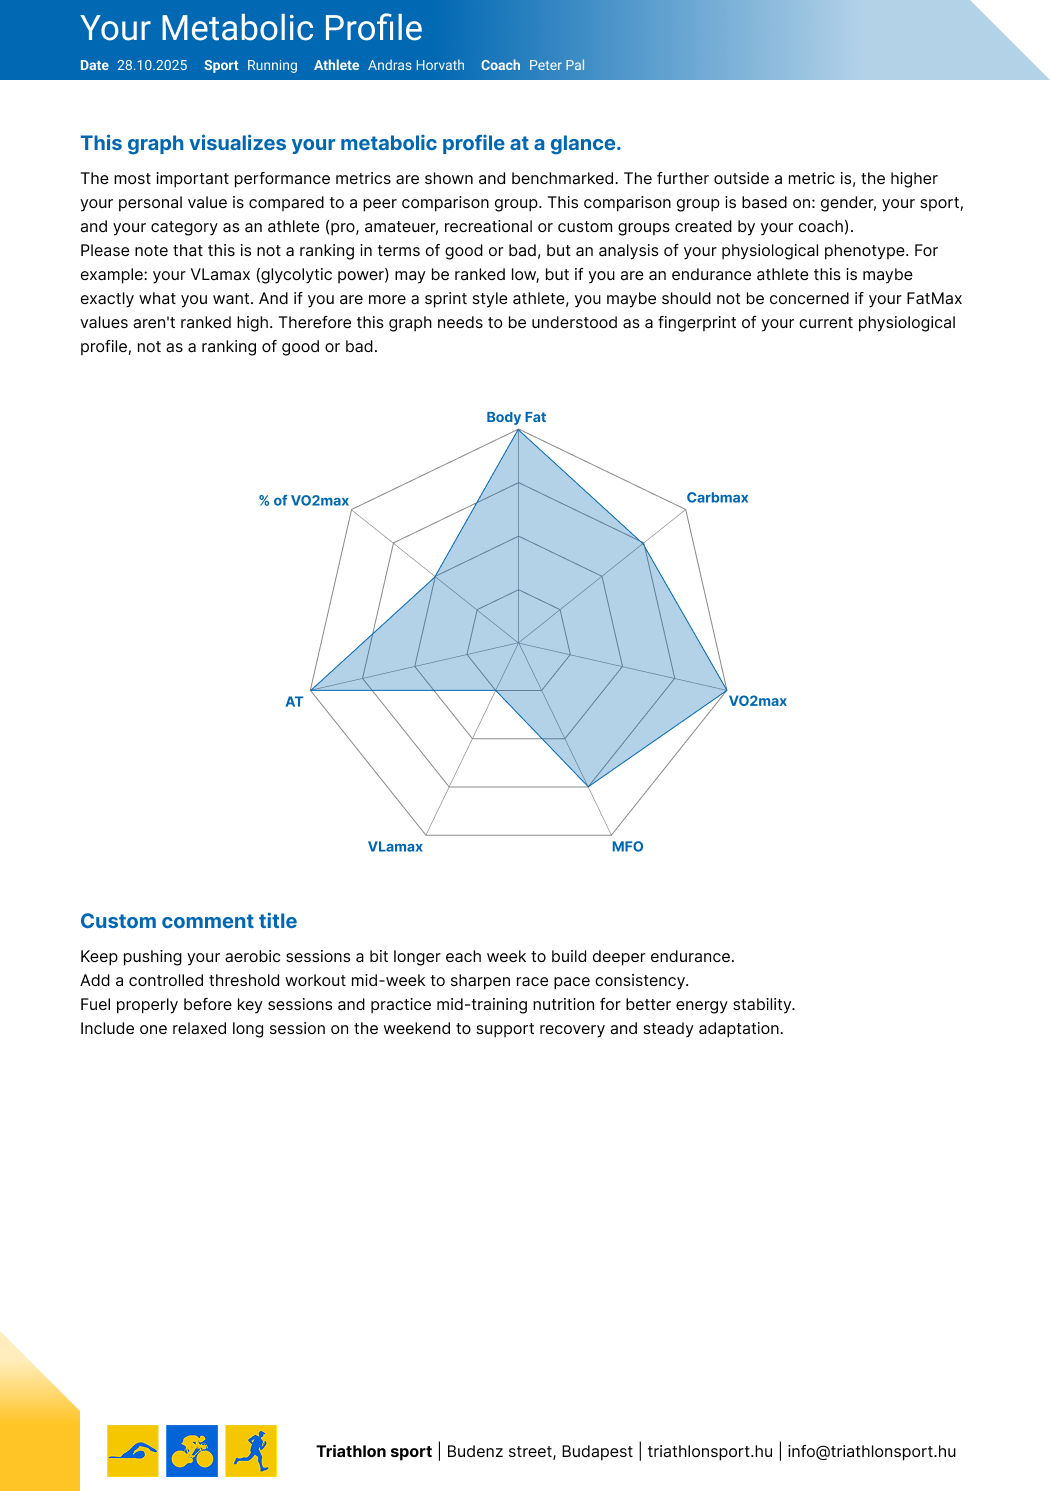
Metabolic profileRadar chart · portrait
Training zonesTable · portrait
You
Your report, your pages

Build the report your clients want

Choose from a wide selection of pre-built pages, each with different metrics, graphs and layouts. Search for a metric like FatMax, fat combustion or lactate accumulation, preview the page and insert it where you want, in portrait or landscape. Arrange everything from the outline, then save the result as your own template.

Pre-built and custom templatesPortrait or landscapeDrag and drop reorderingSmart graph and text combinations
Coaching insights

Your coaching. Your Expertise. Your Report.

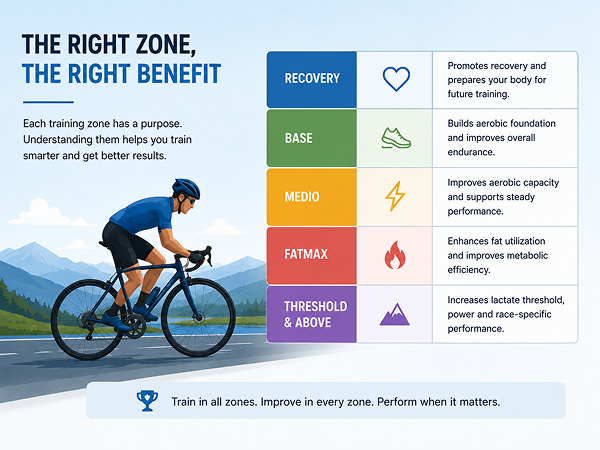
Insert free text pages to add training recommendations, interpretation guidance or client-specific notes directly in the report, with a full text editor for font size, color and formatting. You can also add pages with your own images to add graphs, workout example or anything else you like.

Free text pagesFull text editorCustom image pages
Your Coaching NotesDate 14.07.2026Sport CyclingAthlete M. RossiCoach A. Keller
Drop your image hereAn explanatory training zones graphic added to the custom report page
Coach notes · race block
15 pxBIU

zones-explainer.png
You
How it works

From test to report in three steps.

Creating a report directly from reviewing the test result. As simple as clicking a button.

1

Open the analysis

Any test will work: field, lab or remote.

Any test, any sport
2

Pick a template

Choose one of your existing custom templates, adjust pages if you want and add your own comments for the athlete.

Your saved templates
3

Generate the PDF

Download the finished report and hand it over on the spot, or send it straight to the athlete or team manager.

One click
Every metric that matters

One assessment. The complete picture of your athlete’s physiology.

VO₂max, VLamax, FatMax, thresholds, fuel use and training zones, from a single test in the lab, in the field or fully remote.