Cycling and running power combines aerobic and glycolytic energy contributions that vary with intensity and between individuals. Understanding how your power is composed changes how you prescribe training and set training zones.
Yes, power has advantages over speed and heart rate. But if you want to fully exploit its potential, you need to know how your running or cycling power is composed. How much power is coming from the aerobic vs the anaerobic energy system? And which fuel source contributes most to your power output? In this article you learn how to find out how your power is composed and why this matters. Let’s get started!
Here’s a quick overview of why power is such an improvement compared to speed or heart rate.
Before we had power or heart rate, speed was often used to benchmark fitness and exercise intensity. In fact, in running, speed or pace are still very common. But speed is a result of many external and internal factors like road incline, wind and exercise intensity. You need to take those into account when talking about speed.
As a result, you can’t say fitness increased when speed is higher on a certain day. You also can’t use speed as an accurate way to express exercise intensity, e.g. in training.
So even though speed is often the end goal in many races, it’s not a practical tool in training or fitness monitoring.
Heart rate monitors enabled athletes and coaches to measure exercise intensity. It’s a measure for internal workload.
However, heart rate can differ per day, depending on (external) circumstances. Moreover, since heart rate doesn’t respond quickly to changes in intensity, it doesn’t really help during interval training.
How about using heart rate to determine changes in fitness? When you combine heart rate and speed data, you can say something about performance. For example: “My performance improved, because I run faster at a given heart rate.” But is this accurate given the fact that both heart rate and speed are affected by so many factors? Probably not.
So even though heart rate data can be useful, it’s still not ideal.
Power is an objective and accurate measure of exercise intensity. It only depends on the force and velocity that you apply. Therefore, you can use it to describe training zones, or to measure performance.
But power also has its limitations if you only look at the power number. Some experience 200 watts as an easy intensity, for others it’s super hard. Maybe you found 200 watts challenging a couple of years ago, but not anymore. So to better understand power, you need to relate it to something else.
Functional Threshold Power (FTP) was introduced to put power in context. But we soon found out that there are better solutions.
Before we delve further into this, let’s take a moment to understand the origin and concept of FTP. The following video provides a comprehensive explanation of FTP and its physiological implications.
Knowing your FTP (or anaerobic threshold) is an easy way to put individual power numbers into context. It allows you to track your FTP over time to monitor fitness progress. But is FTP a good measure for performance?
There are not that many sports events in which the anaerobic threshold is race decisive. In fact, you don’t even spend that much time on FTP. Not even when doing a time trial event like a marathon or IRONMAN.
Here’s why many coaches and athletes are overthinking their anaerobic threshold or FTP.
At least FTP is a good way to create training zones, right? Well.. It only allows you to determine one training intensity accurately: the intensity at the threshold power.
Let’s assume you want to work on your VO2max and use 120% of FTP for your intervals. One athlete can be 10% below his/her VO2max power while another athlete can be 10% above his/her VO2max power. In other words, the relationship between FTP and VO2max is not a fixed relation that can be expressed in a percentage of FTP. It differs per individual:
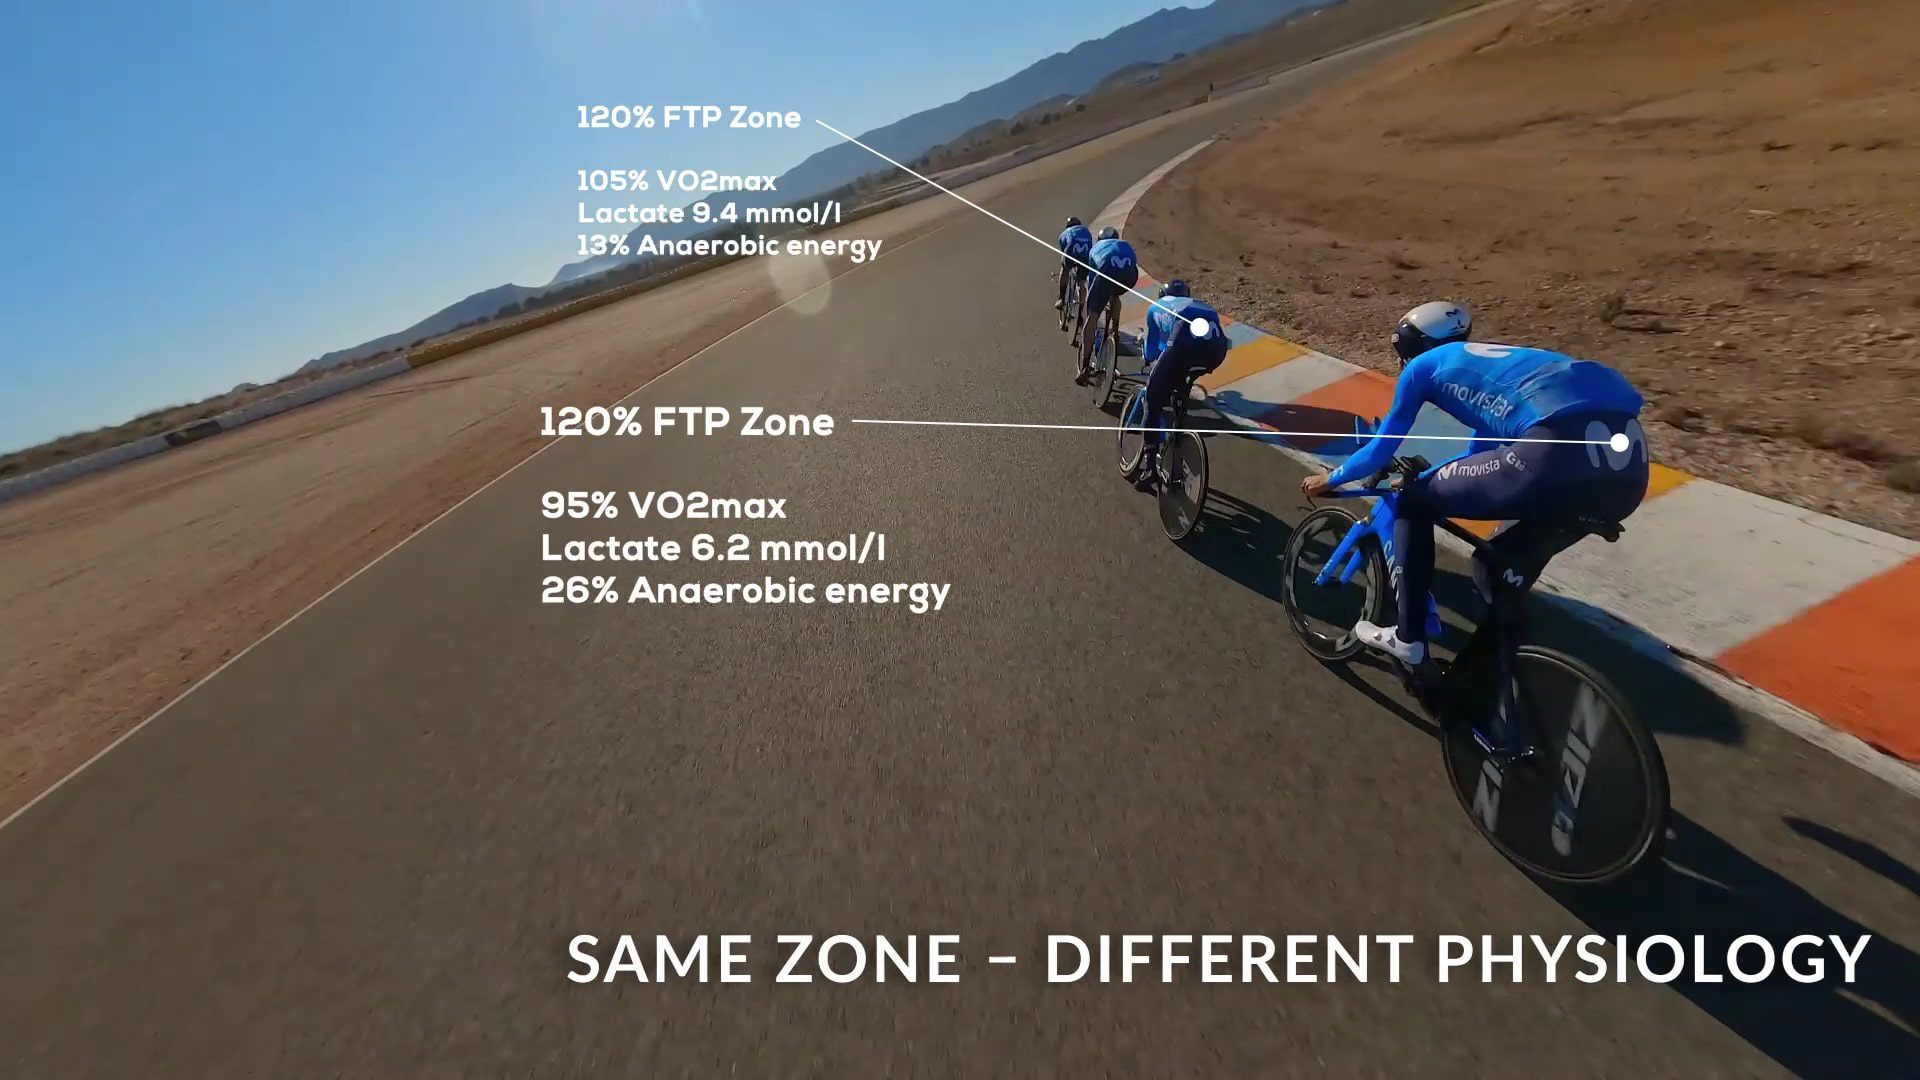
In this example, it becomes clear that these athletes will have a different training stimulus on the aerobic energy system when they both ride at the same percentage of FTP.
With the INSCYD Training Zone Builder, you can easily fix this issue. It goes beyond the scope of this article to dive deeper into these training zones, but we highly recommend reading this article: Stop using old-fashioned training zones – instead try this.
“In order to really understand how your power is composed you need to look beyond FTP and look inside your body and muscles”
If you interesting how to measure VO2max without visiting a professional lab, utilizing field tests, sports watches, or online calculators. This article – “How To Calculate And Measure Vo2max: Testing Outside A Lab“. It explains different ways to measure your VO2max without requiring expensive lab equipment.
To delve deeper into the concept of power and its composition, you can watch our webinar – The Physiology Behind Power-Duration Curves. It provides a comprehensive understanding of the power-duration relationship and its significance in training, including the physiological origin of critical power and how it’s energetically composed.
As we’ve explored, understanding your power goes beyond FTP. It requires a deeper look into your body and muscles, and how they contribute to your power output. This is where INSCYD can help.
Are you a coach or do you run a lab? Are you interested in providing your athletes with a more comprehensive analysis and training? INSCYD offers a free 1:1 consultation with the team of experts for non-users. This is an opportunity to learn how you can leverage INSCYD’s advanced tools to better understand and enhance your athletes’ performance.
Don't just stop at FTP. Go beyond, and unlock the full potential of your athletes.
To get a precise picture and understand your power for real – and to plan your training zones specifically so that you can really target your needed fitness goals – you need to understand your power beyond FTP. You need to know how power is composed, which answers the question: What produces the power inside your body and muscles?
Let’s look at the infographic below to explain why it’s important to look “inside” your power numbers. Take into consideration a generic “Day 1”, where you averaged 475 watts for 4 minutes. After a couple of training months, you re-test your fitness level on “Day 2”.
On “Day 2” you also averaged 475 watts for 4 minutes. Does this mean that the training didn’t work? That depends on how the power is composed! Metabolically speaking, the composition of these two power performances can be very different:
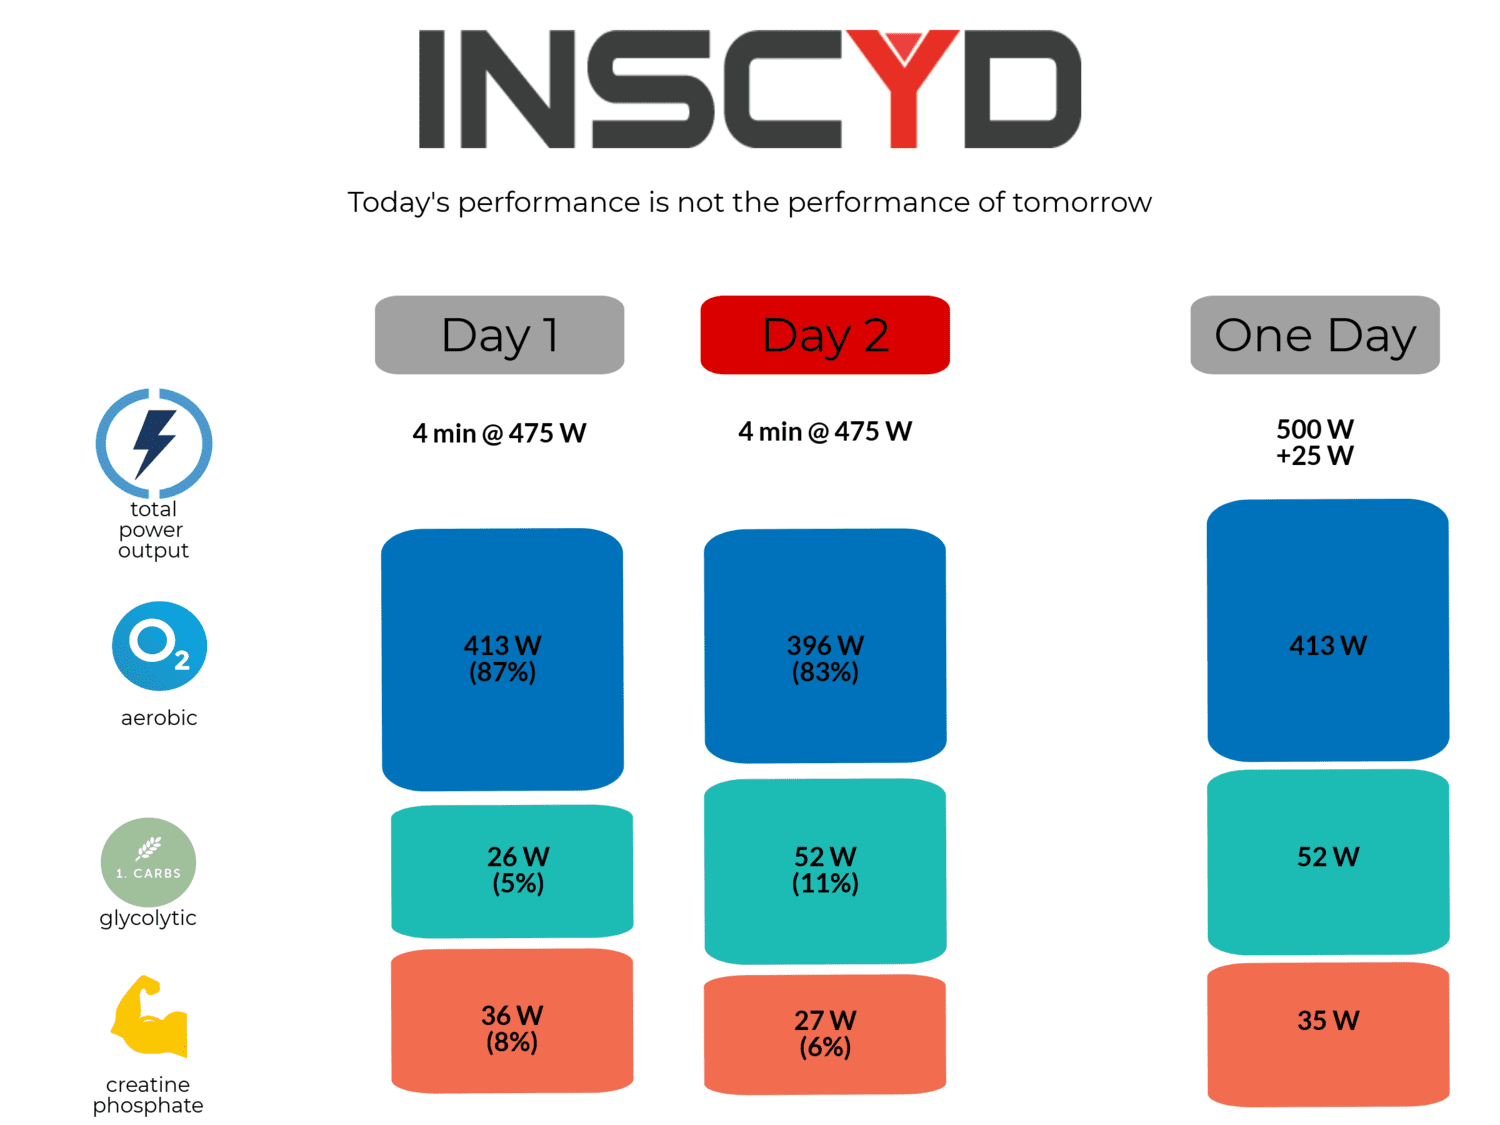
On Day 1, your power was mostly from aerobic metabolism (413 watts, 87%), with only a small contribution from glycolysis (27 watts, 5%) and creatine phosphate (35 watts, 8%).
On Day 2, after your training period, the power was composed in a different way. Aerobic energy contribution dropped to 396 watts (83%). The power derived from glycolysis increased to 52 watts (11%) and the power from creatine phosphate dropped to only 27 watts (6%).
When you look inside the power numbers, you notice that training actually did affect your performance. The three energy systems that compose your power output changed through training – and each one of them went into another direction. You would not have noticed this change when only looking at power numbers.
For a more detailed understanding of training intensities and the role of the anaerobic threshold or FTP, consider watching this webinar – Why you should – or shouldn’t base training intensities on anaerobic threshold / FTP. It offers valuable insights into how an athlete’s metabolic profile affects the energy supply at a certain intensity and other metrics to decide on training intensities.
Now, you may think these changes don’t matter that much. In the end, the total power for your 4-min effort didn’t change. But here’s why this does greatly impact your performance and future training plans.
The energy source of your power number matters, because it makes a huge difference in performance. Let’s take things to unrealistic extremes to make this clear.
Imagine the energy contribution of your 475 watts effort was mostly aerobic on day 1, and mostly glycolytic on day 2. On day 1 you would rely on fat as a fuel. You wouldn’t accumulate any lactate and you wouldn’t need your glycogen stores (carbohydrates in the muscles).
On day 2 on the other hand, you would rely on carbohydrates as a fuel. You would rapidly see an increase in blood lactate concentrations and your glycogen stores would plummet.
You can imagine how this impacts your performance, even though the 4 minute power is the same.
So yes, knowing the origin of your power allows you to understand what the actual effect of your training program was. You now know exactly how your body adapts to a specific training stimulus. Do those intervals really boost your aerobic engine? Or is that higher power number a result of an increase in glycolytic energy production?
Knowing the energy contribution also helps when setting new goals for your future training program. The goal is not only to “increase power”, but to increase power from a specific energy system.
INSCYD enables you to look inside those power numbers and understand the energy contribution:
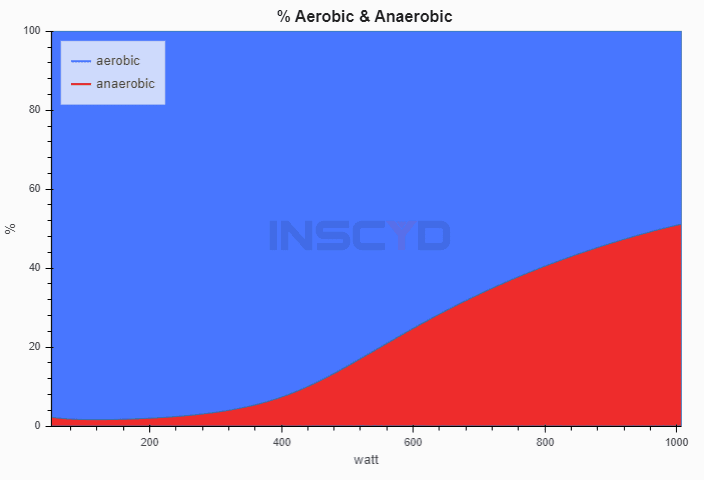
Obviously, these graphs highly depend on your individual metabolic profile. Which you can determine with an INSCYD test.
As you can imagine, the energy contribution is directly linked to metabolic processes like lactate production and lactate recovery. This again emphasises the need to know how power is composed.
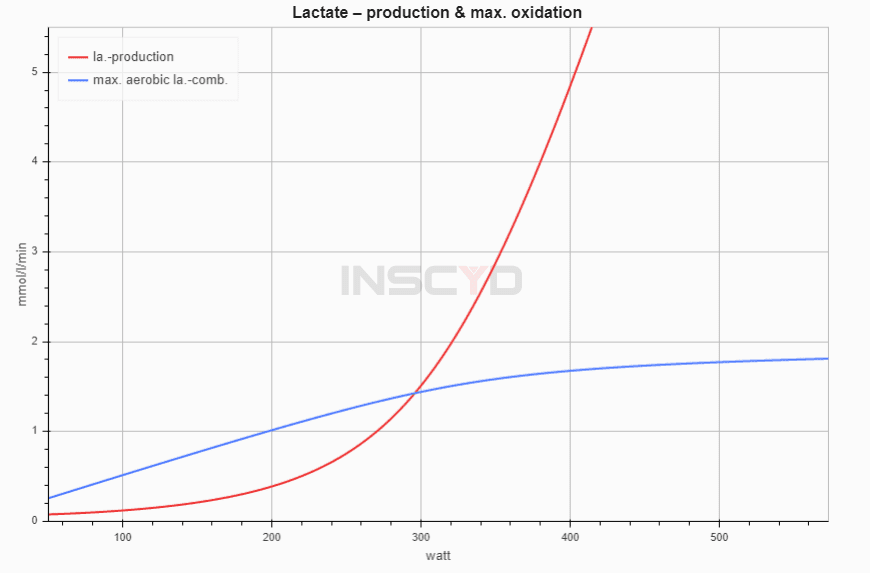
The energy contribution of your power number also impacts the fuel necessary to maintain that power. INSCYD shows exactly which fuel contributes to your power:
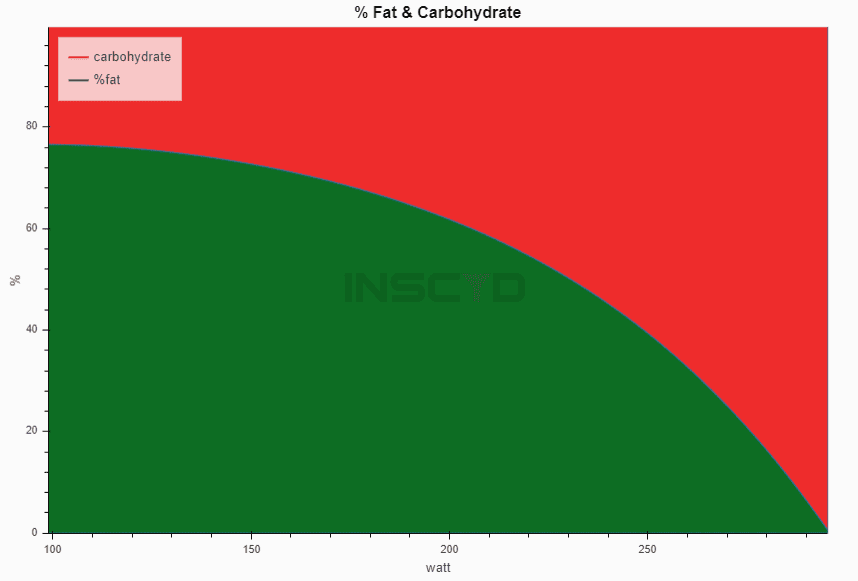
As a result, you know how to fuel during training and racing. You will also find out that some athletes need to fuel differently, for the same amount of power.
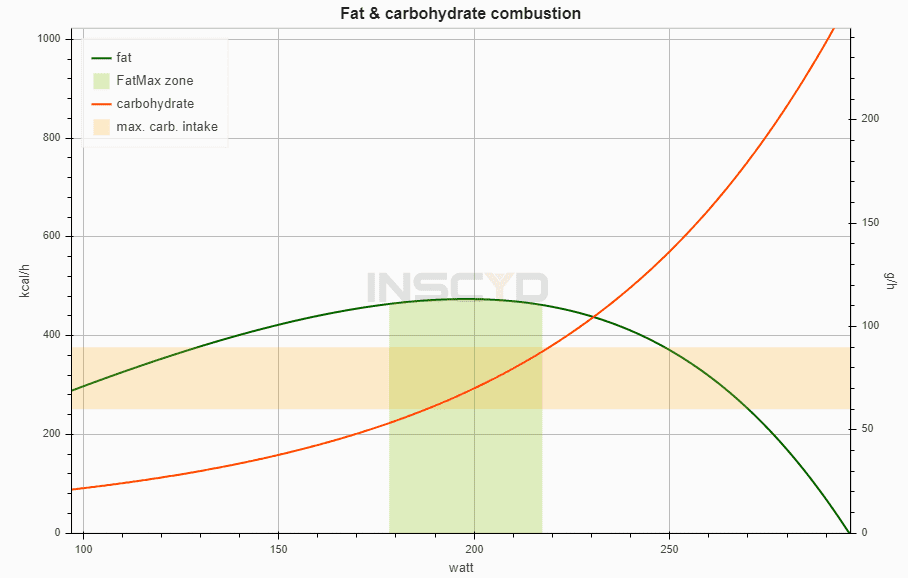
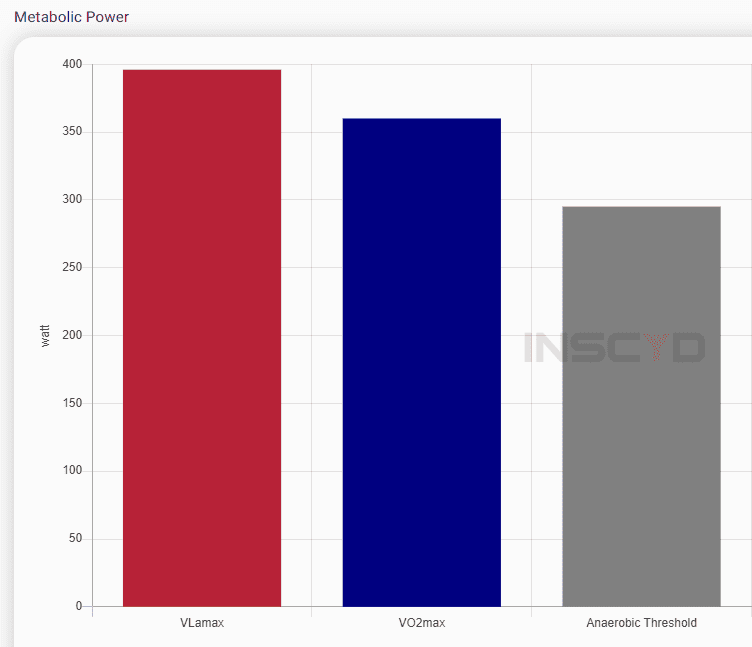
You can use changes in these graphs as a way to track performance over time. You can also look at the maximal power that an energy system can produce, and use this to track progress:v
Last but not least, you can also decompose power in non-steady-state intervals. Simply use the INSCYD Training Zone Builder, plug in a power number and a time duration, and get all the data you need.
Here’s an example of a 60 second interval at 355 watts (120% of anaerobic threshold for this example athlete).

After 60 seconds at this power number, the athlete will have a lactate concentration of 3.4 mmol/. He will burn 554 grams of carbohydrates per hour. The energy contribution is 67% aerobic and 33% anaerobic.
Power meters have been commercially available since the 80’s. It’s time to give this metric an update by understanding how it is composed. Once you know how your power is composed, you can use this to:
By benchmarking your performance and monitoring your progress with INSCYD, you will disclose the origin of your power output. INSCYD is the number one choice of some of the best athletes and coaches, to understand how power is actually composed.
Start to decompose your own power with INSCYD right now. Coaches and labs can book a free software walkthrough to become an INSCYD coach, simply select bellow your preferred language and choose a time that suits you best in your time zone. Athletes can perform an INSCYD test by finding an INSCYD lab or coach here
With INSCYD, you can tailor training programs with unparalleled precision, ensuring your athletes achieve their peak performance faster and more efficiently.
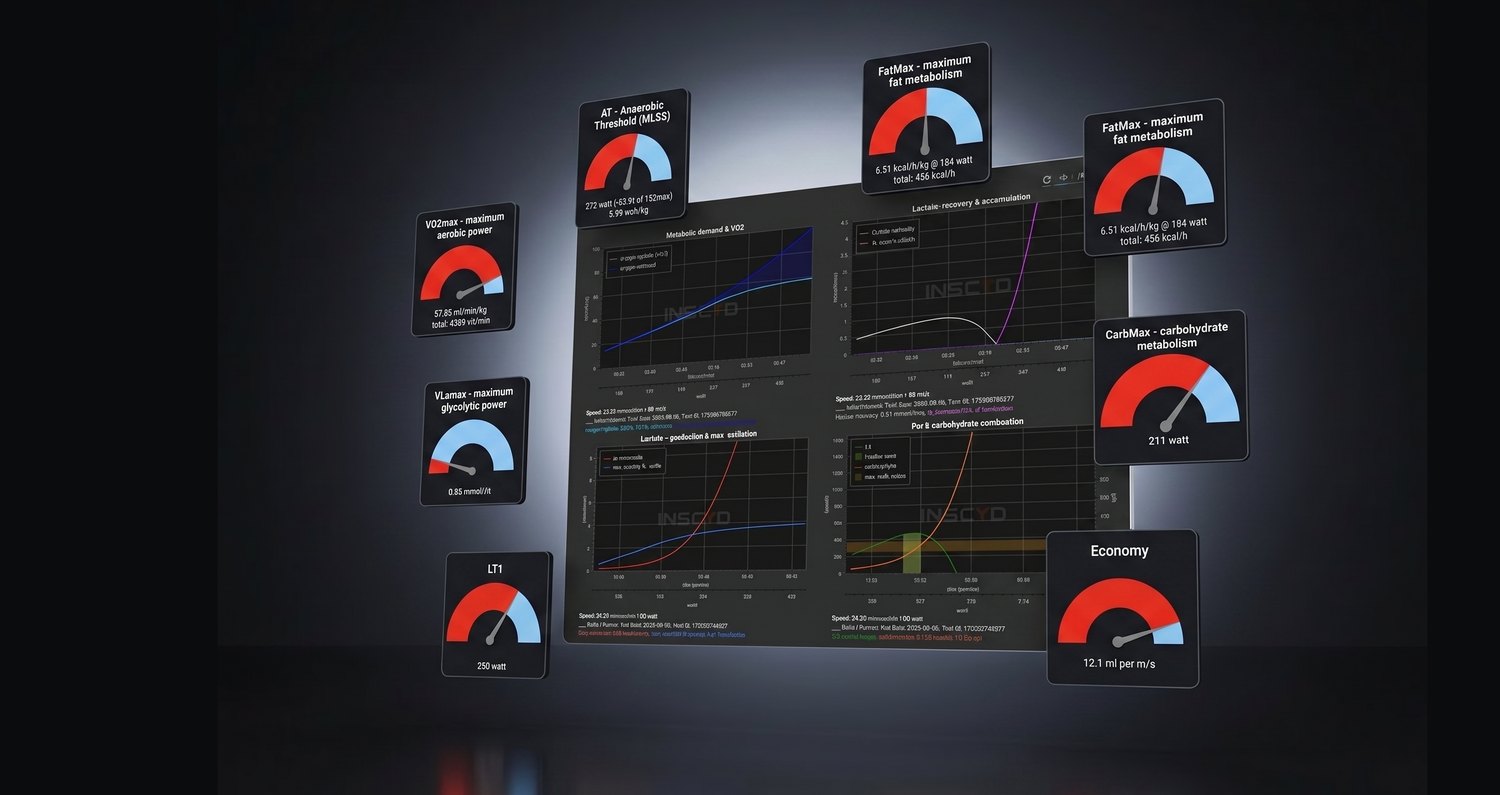
VO₂max, VLamax, FatMax, thresholds, fuel use and training zones, from a single test in the lab, in the field or fully remote.

