The Physiology Behind Power-Duration Curves
Duration respectively Speed vs. Duration analysis has a long history in sport science. Power-Duration relationships have become very popular and also very useful in managing training & performance in endurance sports - particularly in cycling.
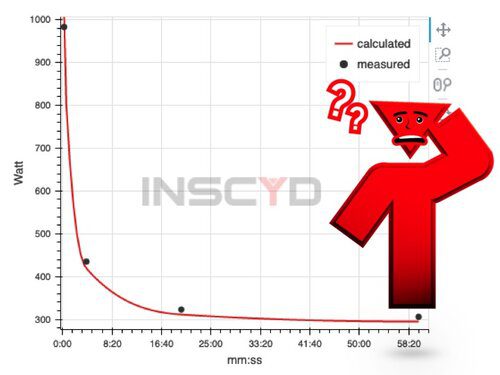

Power vs. Duration respectively Speed vs. Duration analysis has a long history in sport science.
Power-Duration relationships have become very popular and also very useful in managing training & performance in endurance sports – particularly in cycling. It provides a relatively easy way to get an idea of the performance of an athlete. Watch the webinar:
Besides a significant amount of knowledge and scientific data on this topic, the physiology behind the power duration relationship seems to get little respect in its application to training. As a consequence, benchmarks such as critical power and moreover W’ are often misused and misinterpreted.
Agenda
– The creation of a Power-Duration relationship
– The effect of different ways to capture data in the power-duration curve.
– The physiological origin of critical power
– W’ (FRC) – what is W’? How is it energetically composed and how does it change?
The Presenter
Sebastian Weber, coach of 4x time World Time Trial Champion Tony Martin has worked with best athletes and Teams in the sport for more then a decade, including: Peter Sagan, André Greipel, Andrew Talansky, Cannondale, Katusha, Lotto, HTC-Highroad.
Sebastian is a consultant to several organizations, includung the french national swimming federation, cycling ireland, Team JUMBO-VISMA, german swimming & speed skating federation, and numerous private coaching business in europe and the US. He has his roots in coaching amateur and recreational athletes and founded the STAPS coaching & testing business in 2006.
0:00 So agenda for today is going to be,
0:07 what is the power duration curve? And how do we determine critical power on W prime, CP for critical power? And again, everybody here in this webinar who has a scientific background is that, you have to bear with me a little bit. We're going to start from the basics because we have, happy to say that we have the biggest group here in terms of our tendencies and we have a quite mixed group in terms of their background. So we're going to start from scratch and really from the beginning.
0:37 Then we're going to talk about the effects on the data capture. So how does the data capture effect your power duration curve and therefore critical power on W prime. And then we go more and more into the physiology here, which is what physiology speaking creates critical power, why it exists, why we have this phenomenon. And then we're going to look at the mechanics and especially the energetic composition of W prime. And we will use the terms FRC or AWC because that's basically technically meaning, meaning the same thing.
1:14 Okay. So that should be, that should be good. And let's start. What is a power duration curve? For everybody who is not totally familiar with that, what is a power duration curve and how do we tell you term and critical power on W prime? And the basic concept looks basically like this. So when you plot in an X, Y graph, you plot the duration, the time of an effort to failure. So it's only looking at efforts to failure. It's only looking at maximum efforts to exhaustion. And you look at the time to exhaustion and the power output.
1:53 You get kind of this hyperbolic shape. So you have this curve linear, exponential, decreasing power output, and you have this asymptotic part of the curve. And the asymptotic part is called the critical power because basically saying, even if you change the time, if you look on the right side here on the graph, on the X axis, even if the time increases, the power output does not really change a lot. Or in other words, you can say, there's a power that you can hold for a pretty long duration.
2:34 While when you look more on the left side of the curve, obviously, at a shorter duration, higher power output, you cannot just prolong the duration and stay with the same power. Instead, if you prolong the duration a little bit, so if you go a little bit from left to right, just in time speaking, 20 seconds, 10 seconds, 30 seconds, because the curve is so steep here, the power output will change pretty significantly. Okay. So that's the idea of the power duration curve. And again, the asymptotic part is the critical power.
3:05 And now what is stated, and we're going to look a little bit deeper into that, is that the energy, so the time multiplied with the power, the energy that somebody can spend above critical power, is the same for all durations. So that means you have these four dots here in this example. And what it says is, is that W prime is saying that the energy spent at the power time combination marked with one here, so this rectangle has the same size, it has the same area as a rectangle associated with the data point number four.
3:48 That's the concept of W prime here. Okay. Which is simultaneously used as AWC or FRC whatsoever. Okay. And what is important to note here is that this concept is steeped in science. There's a lot of scientific papers, many scientific papers, a lot of scientific research going into that, right? And it's pretty well described and it's pretty solid to say this relationship exists. Mathematically, what we're going to look at here is in order to look at critical power and W prime, what you can do mathematically, simplified speaking,
4:35 you can just plot the work. So the kilojoules, this is basically nothing different than the product, so the multiplication of the power and the time. If you plot the product of power and time versus the time itself, you have this pretty linear relationship, right? So that would be, for example, for this point, multiplying 700 seconds with whatever, 350 watts. And for this point here, the very right point, it would be multiplying whatever, 180 seconds with 450 watts. So then you would get this linear relationship. And mathematically, the intercept, the Y intercept is the W prime, right?
5:17 And the slope, because power is joule per second, and you have joule here and you have second here, so the slope is the critical power. So that's kind of the general concept here, right? That's one way to do it, or let's say the most classical way to do it. Okay. And I created an example athlete here to have one data set, which we can use to work here in this webinar. So the data set that is coming from a real athlete, from real data capture with an SIEM power meter
5:51 is what I use as an example here. Okay. So in this case, 70 kilogram athlete, male, critical power. Critical power is 286 watts, and the W prime here is calculated to 2309. Okay. So that's this part. And then if you plot the W prime, if you plot the linear relationship, in this case, we are getting a very nice R square, so it's very high correlation. And same thing, same mathematics. The slope is the critical power, as you see, and this Y intercept would be the W prime value.
6:34 Okay. So that's the example I just wanted to use, because we're going to use this as we go along this webinar. Okay. Now, the question is, do we always have to do it this way? Or are there different concepts? And most of you, some of you will be familiar that there are different concepts on how you look at those curves, right? How you process this data. And I just pulled out five different ones, how you can process this data. And when, for example, you do it yourself,
7:04 or you do it in WKO, or in Golden Cheetah, or wherever you look at these kind of data, you might actually, I don't know, I think in Golden Cheetah, you might be actually to choose from different models or different ways how you want to analyze your power duration curves. And this is quite important, because the results that you will get from different models, and I know that today in the attendees here, there are people who are much, much bigger experts on that than I am, who spend a lot of their working time and energy on that.
7:42 But long story short, if you do use different models, how you analyze a power duration curve, you will find different results. And because it's very small letters and maybe not so good to see, I wrote or highlighted the differences that you see here. So that is five different methods, how you look at the data. And this is the results that you would get from exactly the same data set, right? It's exactly the same data set, but it is vastly different critical power and vastly different W prime values.
8:20 In case you have a background in doing lactate testing, it might remind you to all these different concepts on how you want to do lactate testing, right? Four millimoles, Dmax, I don't know whatsoever, right? You get the same kind of data set and depending on what mathematical model you apply on it, you get a different outcome, right? And that's a little bit, you know, similar thing here. And important maybe to know, even though R square is not the correct statistic term, what you want to use on exponential curves,
8:53 but even if you look here, the R square values on all these fittings are pretty good. So don't be misled here by those, you know, R square values, how good the fitting is, because even though the fitting can be very good, doesn't mean that you get necessary, get the same data. That's something you just want to be aware of, so to speak, right? So first thing, you have the data. First question is, if you have a powderation curve data, what are you going to do with it?
9:25 How are you going to process it? It's going to vastly affect the results. And that's just important to take into account here. Now, the next thing, you know, even when you decided on a model how to do this, and for example, I understand that WKO has the most accurate in terms of smallest, smallest residuals method on how to cope this deviation of the powderation curve, right? But even then, if you think you have a good mathematical model for whatever reason, the question is, how does the data look like that goes in?
10:08 Because good data in, good data out, bad data in, bad data out. So how does data capture affect this? And this goes more to the practical application. And one thing, obviously, is a power meter. So what you need to be aware of when you look at a powderation curve is that you might see pretty significant differences in the power measurements that come from the powderation curve. And if you have an athlete who only has one power meter and the powderation curve is created only with one power meter,
10:39 that's great. But as soon now, for example, if you have a lot of people doing indoor training and you have data in there from a smart trainer and not directly from the power meter on the bike, you already have two different ways of power measurements. And this obviously changes the data set and changes the results that you get from the powderation curve to a certain amount. And also, something that is maybe overlooked is that when you look at training, the power outputs you're mostly using in training
11:13 are on the lower end, right? Because it's endurance training, it lasts pretty long. You train for several hours. So the power output is 100, 200, 300, 400, whatsoever, right? But in the powderation curve, right? You have data included, which is maybe 600, 800, 1,000, 1,500, whatsoever. And I just pulled something here from the internet, which raised an eyebrow some time ago, two years ago, approximately, pretty much, when it comes to calibration of power meters. Because what most people look at, and this is what I highlighted here,
11:48 is these power outputs that are mainly used in training. But again, if you want to create a powderation curve and you want to create and analyze this based on that, you need to be aware of the error that's potentially in your data, you know, also in the higher power domains, so to speak. Okay? And why I'm pointing this out is because what's happening a lot is that we are using, or we want to use, powderation curve data in order to make informed decisions on the training process,
12:22 or in terms of making informed decision on the development of the performance of an athlete. And as I stated very clearly in the beginning, yes, powderation curve is steeped in science. There's a lot of papers in there, right, out there dealing with that. And what often is forgotten, it seems, is that these are scientific studies. So, the data, obtaining the data, data acquisition is happening in scientific environments, meaning standardized environments. So, the next thing what you want to look at is basically, is training really testing, or can we use the data
13:03 from training for testing? I use this because this phrase has been becoming a little bit more and more popular, so to speak, right? So, can we translate these concepts from the scientific studies from the lab one-to-one into the training process? And there are some specificities in cycling. It's not such a huge problem, for example, if you would look at critical speed in running, it's much easier in terms of the different scenarios and how you capture the data. Okay? So, how would we capture the data? And the specificity
13:36 in cycling is we have to look at the time period of data capture, right? Because what often happens when we create a powderation curve and we don't want to do specific testing for it, we just use the data of the last 20 days, 30 days, 60 days, whatsoever, right? Because, mainly because, we don't want to have the pain of doing an extra testing here, right? We say basically, oh, yeah, within the last one month, there should be enough valid data in there, which I can use. The next thing,
14:07 as I already said, different power meters. Then, especially these times now, you capture the data indoors and outdoors. And specific in cycling, you can capture the data in riding out of the saddle, standing, and riding in the saddle, seated. And on top of that, you can also capture the data in the flat versus enclimes. So let's have a look on how this affects your powderation curve. I just have one slide real quick, because there's tons of stuff out here about time courses of adaptations. What you see here
14:43 is a study, pretty basic, changes of VO2max over different, over a course of several weeks, changes of VO2max in young athletes and old athletes, and you don't have to dive deep into it, it's just about the principle. The principle is, it's a takeaway message is that you can see significant changes, for example, in VO2max within only a few weeks. If you think about it on a molecular level, you know, half-life time of mitochondria proteins, for example, is approximately 14 to 20 days, depending on how much you use it.
15:19 So you have a significant amount of renewal of mitochondria within two to three weeks. So no surprise, you can see adaptation in this time course. So just mentioning, because if you want to look at data that stretches over a time period of 30 days, to assess the performance of an athlete, and you cannot exclude the performance change within 30 days, you may be looking at somehow, to some extent, flawed data here. The next thing is indoor versus outdoor riding, right? You ride outdoors or you swift, right?
15:58 Indoor riding normally produces significant less power, right? significant lower power numbers in indoor riding. That's mostly because of the kinetic energy or the flywheel mass of the trainer for longer durations can also have something to do with overheating and so on. You don't have to look at how big is the effect, how big is the difference. It certainly is also differing, again, from the setup and from the athlete. But just look at this difference here. This is a 40-kilometer simulated time trial. And the difference we're looking at here
16:31 in this case is like 25% or something. So it's very significant, right? And by the way, such a long effort affects, for example, your critical power calculation from such a powderation curve pretty significant.
16:46 Okay? Another study to show you hopefully a more complete picture here. Another study, different subjects. Differences have been much, much smaller. Here in this case, we are looking at an average of 3% on 9 watts, right? So not as drastic as the previous one. Much better study because as you can see in the table, they did different repeated trials in there. So you also have kind of the day-in, day-out variation within doing this simulated 40-kilometer time trial.
17:22 Difference against 3%. So this looks like much more robust in terms of what the expected error really is. Now again, if you have such a data point in your critical power curve, it will drive your critical power almost by the same amount up or down. So if you have an effort in there that is at such a long duration, then what will happen is it will, it will really change your critical power quite significantly. So the effect on a 9 watt difference in the measurement in, let's say,
17:57 a 30-minute or 50-minute time period is obviously much bigger than if you differ 9 watts in a 20-second sprint. So the effect of that on your critical power calculation is quite big. Another example, here we have indoor and outdoor sprinting. And the different angles that we add here is riding out of the saddle, a specificity to cycling. That's what I tried to indicate when I talked about running. In running, you cannot change that much the biomechanics and the position, your body position. In cycling, obviously, you have the
18:32 possibility to ride out of the saddle. And obviously, you are producing higher power outputs or have longer time to exhaustion. So you are changing the power duration curve, especially in the time periods where you ride significantly out of the saddle. And maybe don't care, but the importance is if you want to use the power duration curve and apply the information you pull from that into a training which is mostly done seated, then you should ask yourself, okay, why do I capture the data riding out of the
19:09 saddle standing? It's like, I always come up with this example from swimming. It's like you want to create a program for freestyle swimming and you test your athlete using arms and legs, but he's training only with a pull boy and the legs tied together with a rubber tube on the ankles because he should not use his leg. You would not do this, right? You would test or you would assess the data in the same scenario as you want to use the data for. That's important to know.
19:36 This is not for the sprint. This is for longer duration, several minutes, and you can read the difference in the power riding in the flat in this group of subjects, 280 watts riding uphill but seated six, seven watts more, riding out of the saddle another six watts approximately more. This is the effect that you should be aware that you might see. This is a study here with professionals basically looking at the same thing. This is from the great Aldo Sassi, a little bit older study looking at
20:17 the same thing. Power at the ergometer in this group, 218 watts power output for comparable effort on the flat roads, 330, uphill another 14 watts on top. So highly significant. We are talking about again a couple of percent going higher and higher. And again, most likely if you're just using training and racing data, the data that is used to create your critical power or power duration curve, will have all these mix, this mix of all these different data sources. And even worse than that, in most cases,
20:54 we don't know how much time was spent in a climb, in an effort. Let's say you look at a four-minute effort, you don't know how much time was spent writing in the saddle out of the saddle. One thing to note here in terms of this question comes up, this is not significant. So the changes here are not significant. So just in case a question comes up, because the other studies showing similar effects, but most studies fail to show a significant difference in the average power up and in the
21:23 climb. Fair enough, that's great. it doesn't matter in terms of a coaching perspective if it's significant or not. When you have an athlete looking at his power duration curve, and his critical power, FTP, whatever is calculated from this, is let's say 300 watts, and then after a period of training, it's 310 watts, or 315. This difference is also not statistically significant. significant. You have to decide if you want to have statistical significance, then you don't have to argue, you don't have to interpret 10 watts shift in critical
22:04 power FTP values. You can't have both. You have to acknowledge that the power put us higher on the climb, and obviously higher riding out of the saddle.
22:17 Based on our theoretical athlete here, or the practical athletes that we used, I calculated the power duration curve, as you can see. The blue one is the original curve, and now the red one, for example, is how would the power duration curve look in our example athlete here, which we use, how would it look if all the data capture would be done indoors, and how would it look if all the capture would be done outdoors on a climb. I didn't use outdoor climb standing, because most likely nobody
22:47 is riding out of the saddle for 20 minutes, so that's not realistic anyway. But I just wanted to get you an idea and a feeling for how sensitive is my data for that. And then to give you the results, if we use this example athlete, and this is theoretical data for this example athlete, if you use this example athlete, and you look at the calculated critical power, you will have differences of approximately 10, 15 watts up and down. If you compare theoretically, applying the same differences that
23:23 comes from the literature, if you apply the same to this critical power power duration curve, you're going to see differences up to 15 watts in approximately critical power calculation using the same method how critical power is calculated. And then obviously you get differences in the W prime values from 23 kilojoules down to 22, up to 24. That is the level of changes you would expect to see. So summarizing the first part in terms of data capture, really quick, I just wanted to create some awareness and some sensitivity
24:02 and hopefully make you start thinking about, okay, what data do I really use for my palpuration curve in case you use this? And, you know, maybe I want to do some specific tests or include some specific efforts in the training to have a more solid database here. Okay. Now, looking at the physiological origin of critical power, so why is this curve created from more metabolic point of view maybe to be more precise, right? And I'm going to start with the main graph, okay, you have this hyperbolic
24:41 relationship. And before we link this back into physiology, again, the critical power has been used or is used and it's similar, not saying the same because then some people might get angry with me if I say critical power is the same as anaerobic threshold is the same as FTP. But let's first look again and remind ourselves to the concept of what anaerobic threshold is and what happens at intensities below anaerobic threshold. So below anaerobic threshold, what you see is that you have a stabilization and a steady state
25:17 and blood lactate levels. This is the original definition of a maximum lactate steady state. you have stabilized pH values, you have stabilized steady state oxygen uptake, steady state creatine phosphate levels and depending on this intensity, you can partly use fatty acids and therefore simplified saying you can go forever, of course not, you run out of energy, you dehydrate whatsoever. So that's happening below anaerobic threshold. Now above anaerobic threshold, this changes. You don't see so much steady state anymore. You see a constant increase in blood lactate level,
25:58 you see a decrease in pH values, you see an increase in oxygen uptake which is called the slow component often. This goes along with a decrease in creatine phosphate levels and more and more fatty acids getting pushed out of the metabolism. The result is sooner or later it results in exhaustion, in failure.
26:21 Okay, so that's just a reminder because we're going to need this.
26:26 So what does, for example, the VO2 look like when you look at different efforts on your powderation curve? Efforts that are not at this asymptotic part of the curve but at the part of a few minutes. And here you can see, this is directly comparison. If you have your athlete exercising, in this case, it's something like a four-minute effort to exhaustion, okay, VO2 goes up and you attain VO2 max and then you pretty much have to stop the exercise. If you go a little bit lower in power
27:01 output, go a little bit longer, the time it takes to achieve VO2 max is a little bit longer. And in this case, the athlete is almost riding for a little bit of time at VO2 max, right? But eventually he reaches VO2 max and sooner later he fails. And then if you go a little bit longer and therefore a little bit lower in power output, the point to the very right here at approximately 10 minutes, right? This would be the 320 watt effort. The same happens. The same
27:30 happens. Athlete achieves VO2 max and fails. The time to achieve VO2 max, as you can see in the VO2 curves, in the lower graph, is obviously slower. It takes longer. VO2 kinetics slower. But athlete achieves VO2 max and fails. Okay? And we're going to come back to that. We're going to wrap it up in one more thing. Here's a direct comparison. Here's a direct comparison in the upper visualization. You'll see again VO2 kinetics similar to the previous one. And in the lower one, you'll see blood lactate
28:05 levels. And the dark filtered dots is intensity at critical power. And the non-filled white dots is critical power plus 5%. And now you can see what happens. At critical power, you see a stabilization, you see a steady state of VO2 and blood lactate levels. Again, this is why I showed in the two slides previously, I showed the definition of what changes above and below anaerobic threshold. Same thing. Same thing that you see below and above anaerobic threshold. You write a critical power, you see a stabilization in those
28:45 values, you write above that and no steady state anymore, increase of VO2 and increase of blood lactate levels. right? So let's bring it full circle and go back to our example athlete again. Again, we're going to use this guy more and more often here. Okay, and let's have a look at how in general, again, lactate and VO2 behaves. So again, the upper one is VO2 kinetics. It's three different efforts and the lower one is lactate kinetics. The middle curve is marked as MLIS, which, you know, indicates the
29:24 maximum lactate steady state. You could argue it's already sloping a little bit, so maybe the one below is actually a maximum lactate steady state, but hey, welcome to the difficulties of precisely estimating maximum lactate steady state because this is actually what it is. Okay, so now if you associate again the intensities, that's what we did before, right? We associate the intensity of a certain point in the powduration curve with a certain VO2 kinetics, what we could do in the upper graph here. But what it actually is,
29:58 what might help looking at, don't look at the graph, look at the slope. Okay? When you look, when you take the tangential slope of the powduration curve in a short effort, which leads to exhaustion pretty quickly, right? You have, the curve is steeper, indicated here with the red one. And this steeper incline of the curve is associated with a steeper incline of both VO2 and lactate. So, the slope of the critical power is obviously not translated one on one, right? Actually, slope values are different, but the slope
30:39 of this critical power curve is associated with the slope in lactate and the slope in VO2 kinetics. And you can go to a little bit easier intensity. Then the slope becomes less in VO2 and lactate and the slope of your powduration curve becomes less. And finally, you can go to intensity where there's almost no slope. This is your asymptotic in the critical power curve. And then there's also almost no slope anymore in the VO2 and in the lactate kinetics. Okay? So, this is the link, so to speak,
31:18 between your powduration curve and the metabolism, right? When the intensity is too high, you're not in a steady state anymore. And the higher the intensity, the sooner you will reach failure of exercise, which is, which you can read from the powduration curve on the x-axis, because the x-axis basically marks the time till failure, right? And this is how these two systems are basically linked with each other.
31:53 Therefore, we now want to look at similar physiology behind W' slash FRC, AWC, whatever you want to call that. And there has been some misunderstanding or some development in the understanding of W' or AWC. And historically, what people started to do, and this is where the term AWC comes from, historical, people would say AWC W' prime is anaerobic work capacity. this is where the term AWC comes from, right? So basically saying that whatever this work that is performed above critical power is supposedly being anaerobic, right? And as
32:43 often, once this word is out there, it takes some time, you know, it takes some time until you can change this paradigm. And I just, you know, quoted here Dr. Skiba, who was one of the, you know, researchers doing a lot of stuff about critical power and powderation curves and W' prime, from actually a little tweet from him saying, yeah, defining W' prime as anaerobic is really old thinking. And this has led to, you know, some things where people start to interpret something like a critical power then
33:21 as being the maximum aerobic capacity, performance, whatever turn, doesn't really matter. And the W' prime being your, again, this is where it comes from, I guess, anaerobic work or anaerobic capacity. Now, there is a fundamental error in the error because, again, what we already said in the beginning of this webinar is that the idea is that W' is always the same energy. And so, the W' you can attain within a two-minute effort or between a four-minute effort. So, if it's always the same energy and it is always
34:02 anaerobic, then how would you explain something like this? what I'm trying to say here is everybody knows, so to speak, I hope, I guess, everybody is like common sense, that the energy contribution changes over different durations. And therefore, the energy contribution of W' cannot be just purely anaerobic, obviously, because the energy contribution at different duration changes. okay, so if W' is not purely anaerobic energy, then you may ask the question, okay, what is it? Okay, what is W' created of, or what creates W' from an energetic
34:48 point of view? And to start looking at this problem, you might just want to look at something simple as oxygen uptake in an incremental exercise test. That's the blue curve here. blue curve is oxygen uptake, incremental test, the green curve, which looks like stairs, is the power output that increases. And in this yellow circle, I marked the area where you could suggest anaerobic threshold to be, right? Okay, so what happens now above anaerobic threshold? So we just came to the point where we say, okay, critical power
35:30 is something similar to anaerobic threshold. Again, I'm not going into the details and I'm not going to argue about if it's five watts more or five watts less. Again, that depends on the models that you're using, mathematically, for both threshold and critical power. power. So if anaerobic threshold, critical power is marked here with this yellow circle, then what's happening to your aerobic metabolism shown with a common marker of oxygen uptake? What is happening when you exceed intensity of critical power? It keeps going up. So this already says
36:07 if your aerobic system increases its energy turnover, it increases its activity when you exceed critical power, already means that obviously critical power is not your aerobic capacity. Buter max is that kind of aerobic ! capacity, you want to take it this way. That should be pretty clear. So when we exceed critical power, energy contribution from the aerobic system increases and that has to affect W prime. So let's look at this in more detail. because it seems that's hopefully getting to get pretty interesting. So in this guy
36:46 here, our example athlete, there's a gross efficiency, his VO2 max that he has, because he has a VO2 max of 69 measured in a lab in this case. So his VO2 max at a gross efficiency would equal 386 watt. Again, critical power 296, which is 82.5% of VO2 max. So now just pick one example effort. Let's say he's riding at four minutes, and luckily four minutes is approximately in this case reading from the curve watts. Okay. Okay, so what does this imply for how the energy is
37:28 created? So let's do the math here. He's riding four minutes at 386 watts. His critical power is 396. So that means his energy or power spent above critical power is 90 watts. Right? And 90 watts for duration of four minutes is 21.6 kilojoules, so 2100 kilojoules here. Okay, and now if he would obtain VO2 max, because we already said that he's obtaining VO2 max, because he fails, right? That's what we've seen in the previous slides. Then the additional energy, the additional energy he's getting from his VO2
38:15 max, or his VO2 max is 12 point, approximately 12.1 milliliters per gauge higher than the VO2 at critical power. So his additional energy he could get from his VO2 theoretically is maximum 68 watts ish or 16.2 kilojoules. Okay, so at the end of the effort, at the end of the effort, because we've seen he reaches VO2 max, at the end of the four-minute effort, it would be the case that almost all the energy from this watt could be actually be derived from aerobic metabolism, because he reaches VO2
38:55 max, and his VO2 max equals again 386 watts. Okay, so obviously that's only at the end, so at the beginning of the four-minute, the energy contribution will be different, and then at the end, it might be up to 100% aerobically almost, almost, simplified thing, okay, and how this is affected, this is affected, obviously, by the oxygen kinetics, so the question of how much of this VO prime, or how much of this energy in a four-minute effort is coming from aerobic versus anaerobic metabolism is also a question of
39:30 VO2 kinetics, right? That's one question, and going back to what we've seen before, it is not only the question how fast can you get to VO2 max, it also is a question, as you can see here, maybe how long is he actually riding at VO2 max, VO2 max, and this is all what we don't know, just from looking at four-minute 386 watts, it's impossible to tell how long he's riding at VO2 max, how fast his oxygen kinetics are, and therefore it's impossible to say how much of the
40:01 386 watts and how much of the 90 watts above critical power is coming from aerobic or anaerobic metabolism, right? Now, let's look at W prime at different durations. Look at W prime at different durations because again, the statement is the amount of energy above critical power is always the same no matter if it's a three-minute effort or a six-minute effort. So in this case, I did a two and a five-minute effort, again, coming from the same power duration curve. That's again our example athlete. So what will happen
40:36 in a two-minute effort, because it's comparable small, and I indicated, you know, the critical power versus dashed line, so the red box should imply the effort, right? So what happens when he starts, so to speak, a two-minute effort from zero, from rest? Obviously, VO2 goes up, same as we've seen before, right? So the VO2 goes up, and now what you can say simplifying, if you just want to look at the aerobic energy contribution, that would be the area below the curve, and on purpose, didn't look at the,
41:17 you know, at the area contributing to the P, because we're only talking about the area of energy above critical power, which is, you know, what W' is about. Okay, so depending on the oxygen kinetics, and you can see I didn't use one where he stays a long time at the high, at VO2 max, but even then, even if you have somebody who's just touching VO2 max at the end, right? If you look at the energy, if you look at the area of these two plots here, it's pretty
41:51 obvious, right? It should be very obvious that the energy contribution from the aerobic system, and therefore, because there's nothing else left there, therefore the energy contribution from the anaerobic system is not the same in a five-minute to two-minute effort. So, bottom line is, first, W'frc awc is not anaerobic energy, and second point is, the energy contribution, how much it is aerobically and how much it is anaerobically, changes this different duration of the effort. And, again, if you look at the basic science and you think about it,
42:37 and you think about the energy contribution, let's say, in a 400-meter run and then a 3,000-meter run, both to exhaustion, both to failure, it should be obvious that the energy contribution in a shorter run, in a shorter effort, differs pretty drastically from one that's three kilometers long. That should be pretty obvious, I hope. energy. And just because you deduct a certain amount of energy or you deduct a certain amount of power, your critical power, from that energy in this effort, doesn't change anything about it. So if you say,
43:16 I have an effort, let's say, 400 watts for two minutes, or 300 watts for 10 minutes or whatsoever, just because you deduct 200 watts of critical power, it doesn't change anything about that. then the remaining energy is still differently created for those two different durations. Okay?
43:39 And the last thing you want to look at here is something that hopefully is new for most of you. It is looking a little bit more precisely at your W prime in your power duration curve. And I start again with the signs, because this is where it all comes from, right? This is where it all comes from. And I already said, maybe we do the mistake. Maybe we do the fundamental error of taking power duration curve, which has been created in the lab under same conditions within a few
44:11 days, and apply it to whatever writing conditions or whatever period of time. And there's another mistake that's often done, and this is the times we are looking at. Because if you look closely at most of those publications, then you don't see efforts shorter than two or three minutes. Not with all, but with the most of it. And that's also here. It's a great study, but you can see the longest duration is about 12 minutes, and the shortest one is about three minutes. Okay? They don't look at,
44:45 you know, durations shorter than that. Okay, so back to our athlete, right? This is our critical power curve here, is our athlete. You can see the slightly leveling off. If you would have a different scaling here, you would see it much better. It's a maximum power output leveling off at about 1200 watts. Okay, and this is the work versus time graph I showed you in the beginning, right? Again, nice, nice fitting, right? Everything smooth, but as you notice maybe now, I didn't use any data point below
45:25 120 seconds. So in this case, I do get this nice data when I don't use any data shorter than 120 seconds. Now let's see what happens if I include this, because this is again also what you have included in your, most of your data. So now things change quite dramatically, right? You can see the, critical power changes by 10 watts just because I include the high intensity stuff. And now you can think this further, what if the high intensity stuff is out of the saddle, what if
46:00 the high intensity stuff is riding in the climb, and so on, the deviations can get, can theoretically get bigger. And what you can see is obviously the fitting is not this good anymore, right? The thin black line is the, is the, is the regression line. You can see the fitting is not that close, right? Again, I go back, perfectly fitting. You can't, you can't differentiate between the original line and the fitting line. And now you can see the fitting line is off. Air square, again, is not a good
46:27 value here, still very, very high. So let's zoom in and let's have a look only at times from like one second to 300 seconds. And now you can see there's nothing but, but really, you know, there is no linear relationship between work and time anymore, right? It's, it's not at all linear. It's becoming linear once you exceed two minutes or three minutes of exercise duration. Okay, so what you can see here, there's some kind of, you know, building up, building up of, of the, of, of the W prime
47:08 of the work. So what we can do now, we can plot this as a percentage. So what you see here now is how W prime develops over different time durations. So we took the W prime that we get from all data points, and you can do the same. I really invite you to do the same with your data, right? You can just do it in Excel whatsoever, like I did, pretty simple. Just take the W prime that you have looking at the whole power duration curve or only at the
47:39 one from whatever, three minutes to five minutes, whatever you like, and compare it to the W prime calculated for one second effort, five seconds effort, 10 seconds effort, and so on, right? And you can see it builds up. It builds up. It comes eventually to 100% after, in this case, approximately three minutes or something, right? And then because one effort's a little bit higher, one's a little bit lower, like that's a normal noise that you have in your power duration here, right? It stays at approximately 100%.
48:11 100%. So what this means, if you zoom in like this, attaining the percentage, right, that zoomed in a little bit more here, how does it look like? How does the attaining W prime look like? Well, and it is no, it is no, you know, no error or it's not a coincidence especially. It's not a coincidence that W prime reaches maximum, reaches 100% after approximately two to three minutes. Because when you look at classical oxygen uptake kinetics, you look at classic oxygen uptake kinetics, and this is from
48:53 just a normal textbook taken here, you can find it everywhere, how long does it take for an average trained athlete to reach VO2 max? Well, normally two to three minutes. And this is a time that it will also take for your athlete to attain 100% of W prime. And again, hereby you can see that if W prime would be purely anaerobic and you believe in something like the lower right graph here, where anaerobic energy is maxed in terms of the energy contribution, right? In a 400 meter run
49:30 and in a kilo on the track, so in efforts lasting one to two minutes, right? There's plenty of studies there showing that there in one to two minute effort, or even shorter, maybe up to down to 30 seconds, the anaerobic energy contribution is very high. So if you believe in that, then, you know, it's pretty obvious that W prime cannot be anaerobic because it follows the kinetics of your aerobic system, really. and again, going back to the slope of the auction uptake versus the slope of the curve,
50:05 I hope I could brought it full circle here because it's basically indicating the same things. And with that, I wanted to close for today. Thank you very much for staying that long with me. Thank you.