
Norwegian 4×4 and 40/20 HIIT produce fundamentally different VO2 responses due to oxygen kinetics. Athletes with identical VO2max but different VLamax will respond entirely differently to the same interval protocol.
Right now, Norwegian 4×4 is everywhere.
Podcasts, coaching seminars, social media threads — suddenly everyone is prescribing 4×4-minute intervals around threshold (often described in the literature as MLSS) as if we’ve just discovered the missing piece of endurance training. It’s “evidence-based.” It’s “proven.” It’s “what the Norwegians do.”
We’ve already covered the Norwegian method and how to apply it in training in a previous article. But now we need to go deeper.
Let’s pause for a moment.
A few years ago, it was HIIT. Just recently, Zone 2 became the dominant era.
Endurance training trends move like fashion. What is “in” today quietly replaces what was “in” yesterday.
Yet here’s the important part:
HIIT isn’t wrong. Norwegian-style 4–6 minute intervals around threshold aren’t wrong either.
Both methods are supported by a substantial scientific body of evidence. Both improve VO2max. Both improve performance. Both have been repeatedly validated under controlled conditions.
Scientific data does not become invalid just because a new trend appears.
So how can athletes and coaches report massive gains with Norwegian intervals — while others achieve equally compelling results with HIIT?
If both approaches are well researched and effective, the conclusion cannot be that one is “right” and the other “wrong.”
The more useful explanation is this:
Both methods work. But they do not work equally well for every athlete.
The crucial difference lies not in the trend — but in the mechanism.
The crucial difference lies not in the trend — but in the mechanism. HIIT and Norwegian-style intervals stress the system in different ways. They emphasize different physiological pathways. They challenge metabolism differently. And depending on who the athlete is — from a phenotype and training status perspective — one stimulus may produce different adaptations.
This is what we are going to clarify in this article.
We will show that the real answer is not in the hype, but in the physiology of the athlete.
Because the decisive question is not: “What is currently popular?”
It is: “Which physiological profile is in front of me — and which stimulus will move it forward?”
Before we move forward, we need to ensure we are on the same page and avoid misunderstandings.
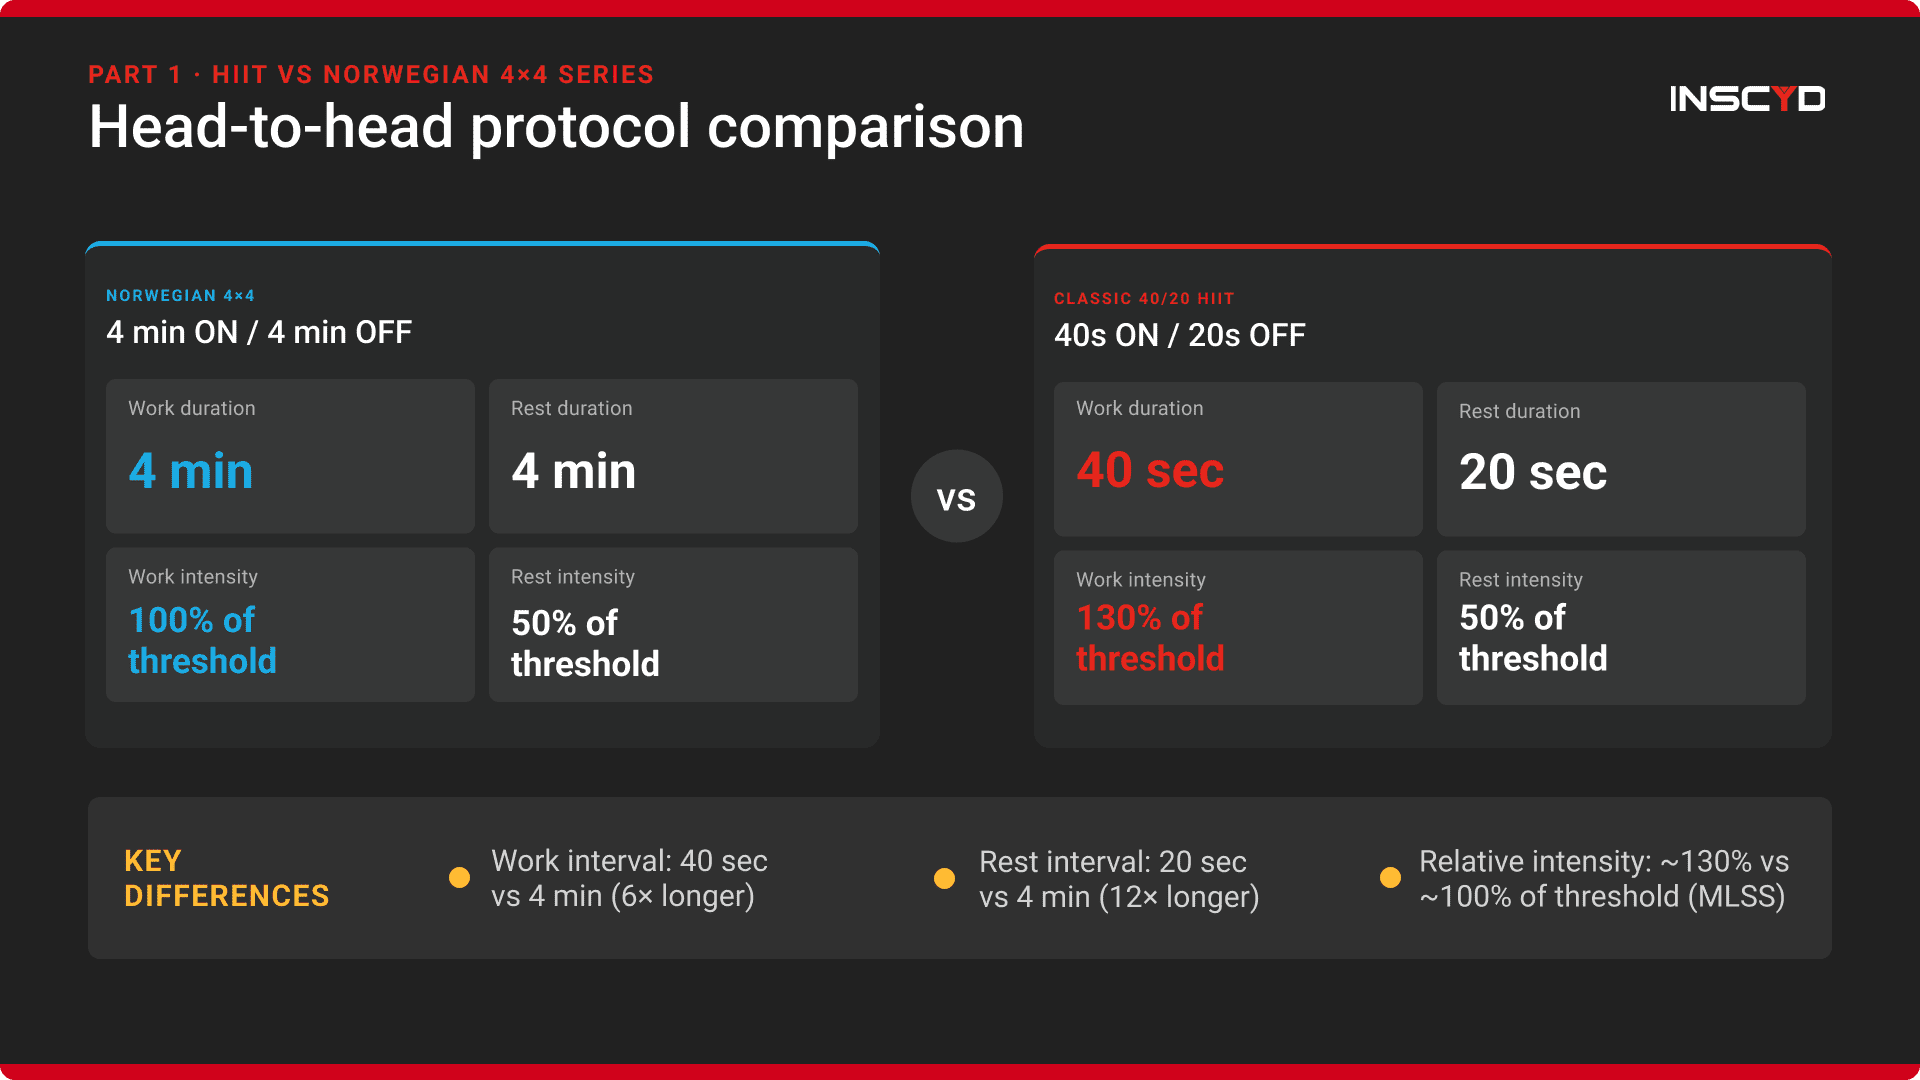
“HIIT” and “Norwegian intervals” are broad terms. Different coaches mean different things when they use them. If we are going to compare these methods meaningfully, we must define exactly what we are talking about.
For this article, we will contrast two representative examples.
The recovery is deliberately low intensity. About 50% of threshold represents very easy work and allows for good recovery in between the controlled intervals.
This 4×4 structure is consistent with the likely most popular version of the so-called “Norwegian intervals” approach.
Prescribing such high-intensity intervals as a percentage of threshold is common practice — especially in cycling and triathlon. Threshold serves as a reference anchor from which supra-threshold intensities are extrapolated. Extrapolation from threshold to training zones for VO2max and high intensity intervals per se is an issue that can lead to imprecise training and unwanted adaptations as described here, but this isn’t part of this article.
The 40/20 format is simply one well-established example we use here to prove the point. A 30/30 structure would operate under very similar principles. The exact seconds are less important than the relative intensity and recovery structure.
| Norwegian 4×4 | 40/20 HIIT | |
|---|---|---|
| Work interval | 4 minutes | 40 seconds |
| Rest interval | 4 minutes | 20 seconds |
| Intensity (typical) | ~100% of threshold (MLSS) | ~130% of threshold (MLSS) |
| VO2 kinetics | Approaches steady state; rises high then falls between intervals | Oscillates; never fully peaks, never fully drops |
| Aerobic stimulus | Depends on athlete's VLamax | Depends on athlete's VLamax |
| Best prescribed by | %VO2max (not threshold) | %VO2max (not threshold) |
In both sessions, recovery periods are intentionally kept low-intensity. What differs substantially is:
Now that the structures are clearly defined, we can start answering the question: why should you (or the athletes that you coach) prefer the one over the other type of interval?
In order to answer this question we need to look at what actually happens inside the body, more precisely the muscles, during this kind of training.
Before comparing athletes, we first need to look at the sessions themselves — and understand how and why these intervals became so popular for increasing aerobic performance.
A practical way to evaluate the aerobic impact of an interval session is to examine oxygen uptake during these intervals. Oxygen uptake may serve here as a proxy for the aerobic training stimulus — the signal to the body to improve aerobic capacity.
Two simple dimensions matter when using oxygen uptake as a proxy for aerobic improvements:
Both dimensions matter but are not equally the same. For example: long low intensity workouts can have a substantial positive effect on growing more mitochondria in the muscle – the powerhouse in muscle cells where the aerobic metabolism actually happens – but less stimulus to increase cardiac output of the heart (HELGERUD, Jan, et al. 2007).
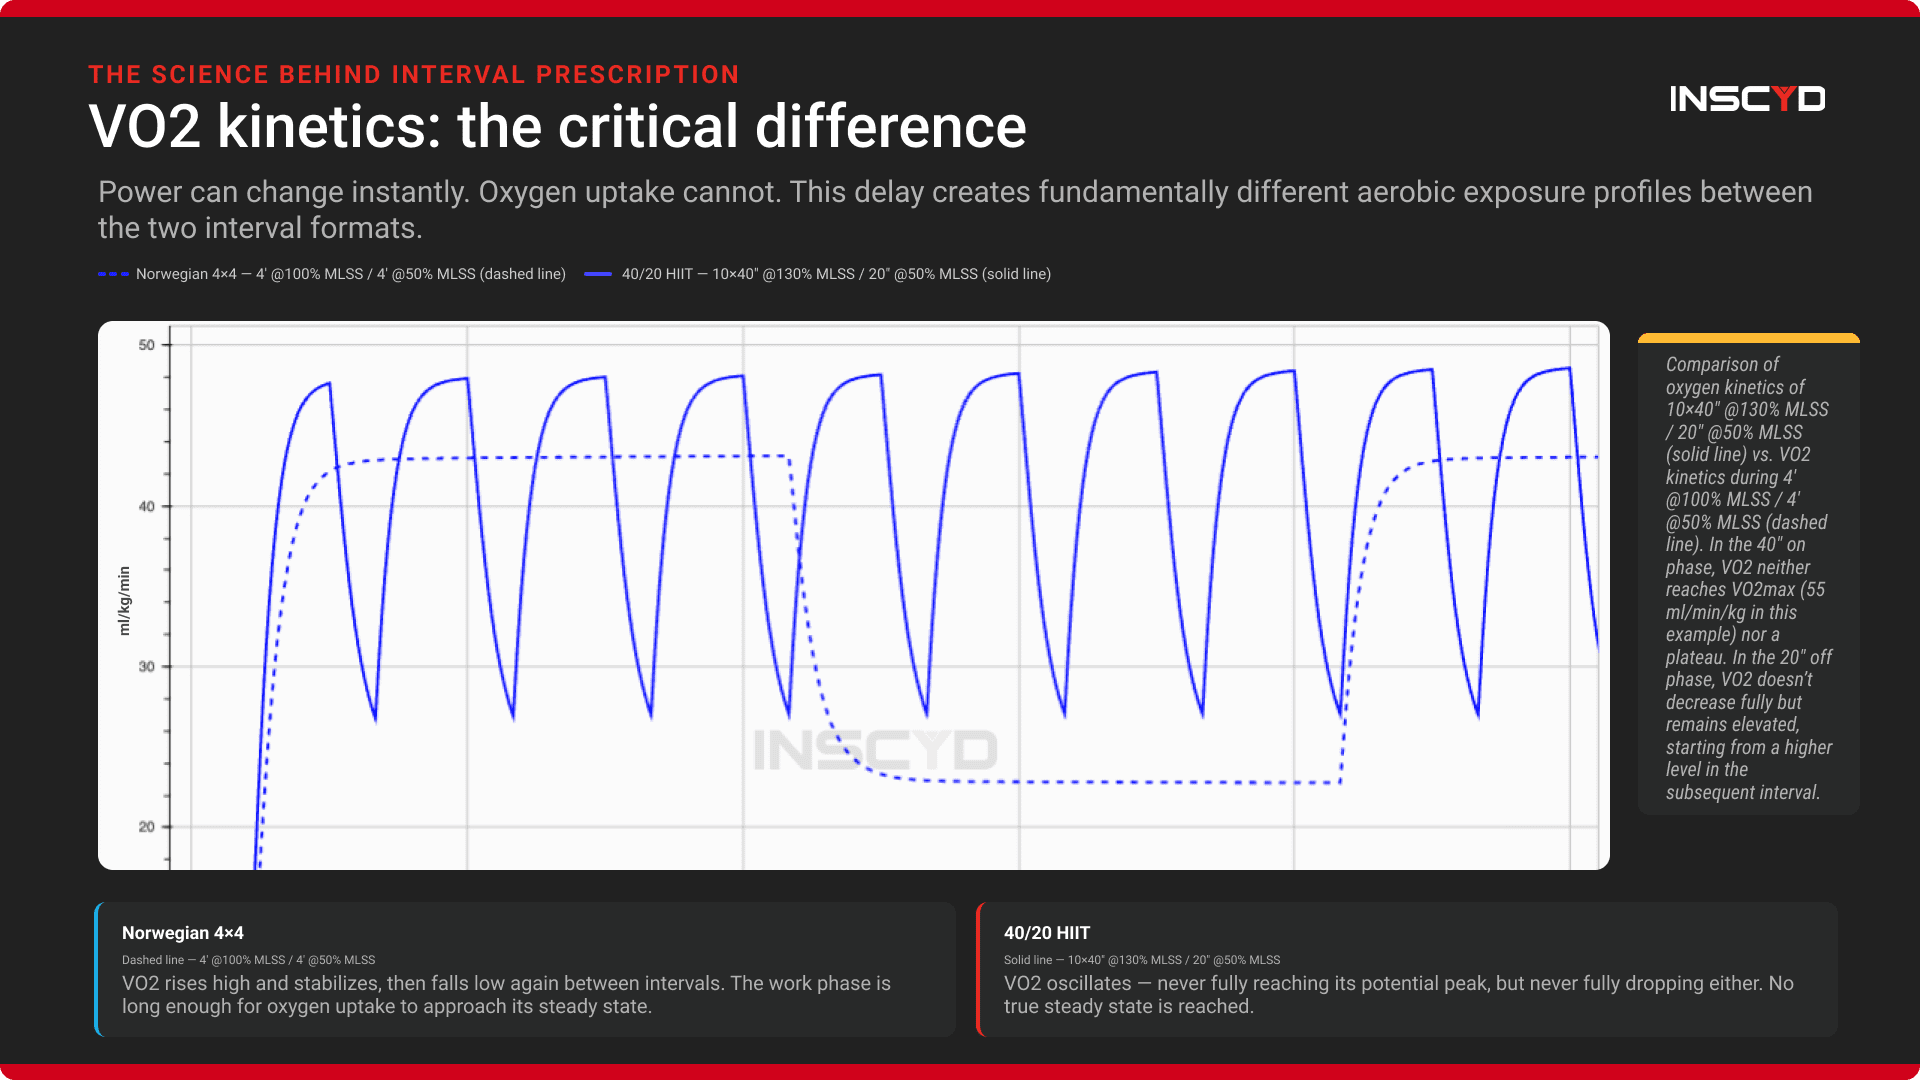
In the 4×4 intervals, the work phase is long enough for oxygen uptake to approach its destined value — its steady state, or near steady state. Once it reaches that level, it remains elevated for several minutes before recovery begins. Between repetitions, the four-minute recovery allows VO2 to drop substantially before the next interval starts.
In contrast, during 40/20 intervals, no true steady state is reached. The work phase is too short for VO2 to fully climb to its potential end value. However, the recovery is also too short for it to return to baseline.
Now, when we compare our two interval formats — 4×4 and 40/20 — an important difference becomes visible.
The difference comes primarily from oxygen kinetics:
Oxygen kinetics are not the same as power kinetics.
Power can increase or decrease abruptly. VO2 cannot.
When intensity rises, oxygen uptake follows with a delay — similar to the likely familiar heart rate kinetics. When intensity drops, VO2 also declines gradually.
This delay changes the exposure profile of the two sessions:
That distinction is central. Because it determines how long oxygen uptake is elevated, how stable that elevation is, and how the aerobic stimulus is distributed over time.
In this video, Sebastian walks through the oxygen uptake kinetics of both protocols, explaining why the 40/20 format never allows VO2 to reach steady state while the Norwegian 4×4 does
Comparison of oxygen kinetics of 10×40” @130% MLSS / 20” @50% MLSS (solid line) vs. VO2 kinetics during 4’ @100% MLSS / 4’ @50% MLSS (dashed line). In the 40” on phase, VO2 neither reaches VO2max (55 ml/min/kg in this example) nor a plateau. In the 20” off phase, VO2 doesn’t decrease fully but remains elevated, starting from a higher level in the subsequent interval.
Now comes the important question: does every athlete respond the same?
Up to this point, we have only looked at the intervals themselves. We established that 4×4 and 40/20 produce different aerobic exposure profiles, both formats are supported by the literature, and both can increase VO2max.
But now we need to ask a much more important question:
Do all athletes receive the same stimulus from the same interval?
To answer that, we must introduce the individual.
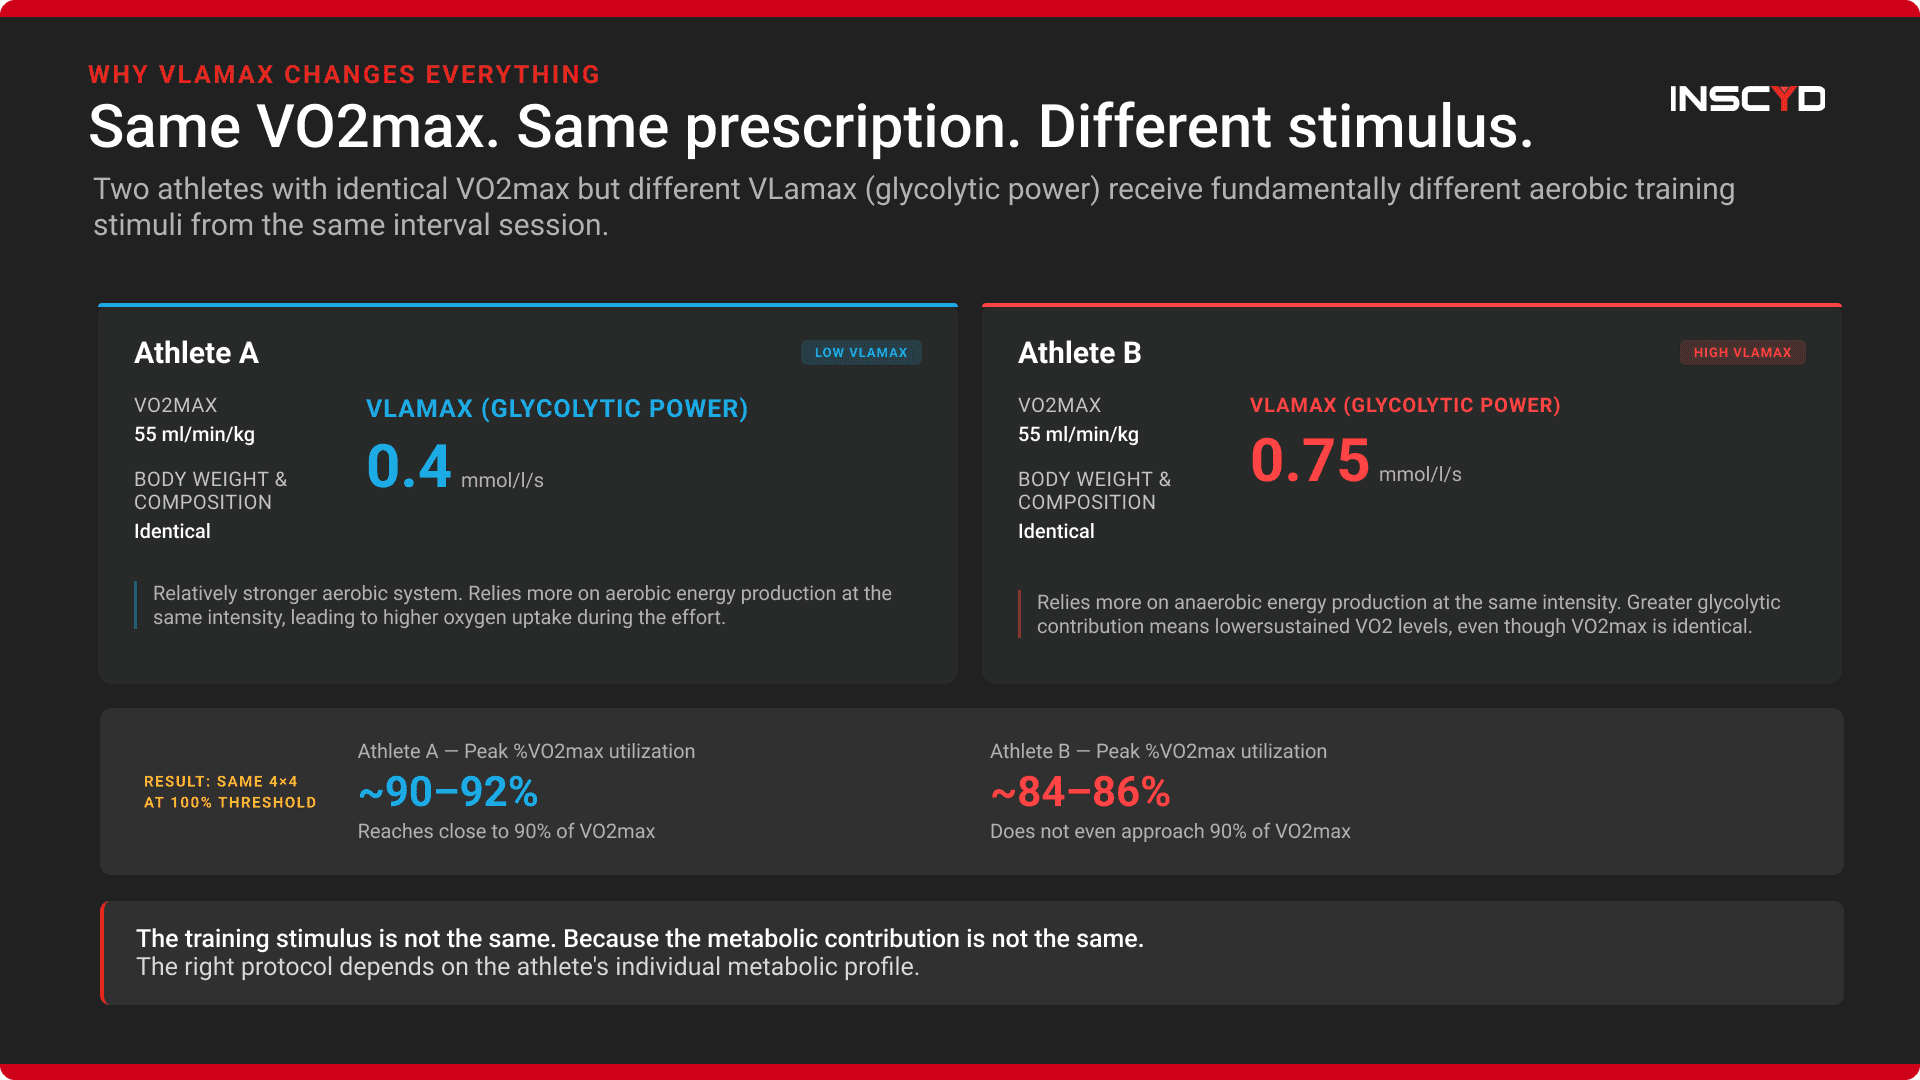
Let’s use two example athletes. They have the same body weight, the same body composition, the same VO2max — the same everything. All key physiological performance indicators are identical — except for VLamax.
VLamax (maximum glycolytic rate) measures an athlete’s anaerobic glycolytic power — how quickly they produce energy through glycolysis. It is a key metric for understanding how an athlete’s metabolism responds to interval training.
Both have the same VO2max. But they are not metabolically the same.
So why does it matter if one athlete is anaerobically stronger?
The interval intensity is based on % of threshold, so it is already individualized to the athlete. So why should a higher VLamax — i.e., higher glycolytic power — affect 4×4 or HIIT training?
The reason is simple:
The energy required for any effort is provided partly by anaerobic energy production — using carbohydrates that are converted into lactate — and partly by aerobic metabolism (which uses lactate and fats as fuel).
How is this energy distribution between those two systems determined? It is determined by the relative strength of the two systems — aerobic and anaerobic — in relation to each other.
So when two athletes have the same VO2max (same maximal aerobic power) but different VLamax (different glycolytic power):
In short: when both athletes perform the exact same interval session — for example, 4×4 at their individual threshold, or 40/20 at 130% of their individual threshold — they do not receive the same aerobic stimulus.
And the reason is not their VO2max, but their VLamax.
The athlete with the lower VLamax — the one who is relatively weaker anaerobically — tends to achieve higher relative oxygen uptake during the same intervals. The more “aerobic” phenotype receives a stronger aerobic stimulus from the same training.
The athlete with the higher VLamax — the more glycolytic phenotype — tends to generate more anaerobic contribution at the same relative intensity. This means more glycolytic energy production, greater anaerobic contribution, and paradoxically: lower sustained VO2 levels. Even though VO2max is identical.
To learn how to manage this, read our guides on tips to decrease VLamax and how to increase or decrease VLamax in running.
At the same VO2max. At the same relative, threshold-based intensity. At the same interval prescription.
The training stimulus is not the same. Because the metabolic contribution is not the same.
This is why choosing between Norwegian 4×4 and HIIT based on trends or general recommendations misses the point entirely. The right protocol depends on the athlete’s individual metabolic profile.
In this part of the video below, Sebastian compares oxygen uptake kinetics for a high glycolytic vs. low glycolytic athlete performing the same interval sessions. During the 40/20 HIIT at 130% threshold, the low VLamax athlete reaches close to 90% of VO2max as peak VO2, whereas the high VLamax athlete reaches significantly lower VO2 values. The same principle applies to Norwegian 4×4: the low VLamax athlete achieves roughly 20% higher fractional VO2max utilization than the high VLamax athlete — despite identical VO2max and identical threshold-based intensity prescription.
There is another simple way to think about it: The athlete with the higher anaerobic capacity has their threshold at a lower percentage of VO2max. Therefore, prescribing 4×4 intervals at 100% of threshold automatically results in a lower fractional utilization of VO2max for that athlete.

There is a more direct way to think about this problem.
We say we want to improve VO2max. We design intervals to increase VO2max. We analyze literature about time spent near 90% of VO2max.
And then — instead of prescribing intensity based on VO2max — we prescribe it as a percentage of threshold and extrapolate from there.
That is the conceptual inconsistency. And it’s one we’ve explored before in HIIT training: intensity based on %FTP and its shortcoming.
If two athletes have the same VO2max but different VLamax, their threshold sits at a different percentage of VO2max. That means:
When prescribing 4×4 at “100% of threshold,” the aerobic trigger is not the same.
Same VO2max. Same threshold-based prescription. Different aerobic stimulus.
Now that we recognize the problem, the logic of the solution becomes clear.
If the goal is to stimulate VO2max, then interval intensity should be anchored to VO2max. Not indirectly through threshold.
By prescribing intensity as a percentage of VO2max — and by understanding the oxygen kinetics behind it — we can directly target the intended fractional utilization.
The INSCYD Training Zones Builder allows you to do exactly this: receive the %VO2max for any interval duration and interval intensity. This way it becomes possible to understand the exact aerobic training stimulus in any interval training of interest. Learn more about how it works.
In this part of the video, Sebastian walks you through the Training Zones Builder with both athlete profiles — and shows why prescribing intervals based on %threshold produces fundamentally different aerobic stimuli.
Training zones for Norwegian 4×4 are based on maximum aerobic power for both: a) a high anaerobic (glycolytic) athlete, b) a low glycolytic athlete. Because the intensity is set to 80%, 90%, 100% of aerobic power, the target training intensity is the same for both athletes as they have the same VO2max. This leads to comparable average %VO2max utilization from low 70% to around 85%. However, the training intensity expressed as % anaerobic threshold (similar to LT2, FTP) is significantly different. For example: to achieve 80% VO2max utilization, the low glycolytic athlete needs an intensity of 112% of threshold. In contrast, an almost comparable 77% utilization of VO2max requires 134% of threshold power in the high glycolytic athlete.
This approach ensures that two athletes with the same VO2max but different metabolic profiles truly receive the same aerobic trigger.
This article covers the science behind interval prescription. At the 4-Day Hands-On Camp on Physiology, Diagnostics, Nutrition, and Training Adaptation, you go further: hands-on physiological testing with real athletes, building metabolic profiles, and applying this knowledge to training decisions on the spot.
Over 4 days, you will conduct lactate and VO2 testing at the running track and on the road, learn how to interpret and apply metabolic data to training programs, and answer the question this article raises: how does the physiology of an athlete determine whether to go long and easy or short and hard?
Guided by Sebastian Weber — the scientist and coach behind multiple Olympic champions, 9 World Championship titles, and Tour de France victories.
Laursen, P.B. & Jenkins, D.G. (2002). The scientific basis for high-intensity interval training. Sports Medicine. DOI
Helgerud, J. et al. (2007). Aerobic high-intensity intervals improve VO2max more than moderate training. Medicine & Science in Sports & Exercise. DOI
Daussin, F.N. et al. (2008). Effect of interval vs continuous training on cardiorespiratory control. American Journal of Physiology – Regulatory, Integrative and Comparative Physiology. DOI
Rønnestad et al. (2015), Scand J Med Sci Sports. DOI
Odden, I. et al. (2024). European Journal of Sport Science. DOI
VO₂max, VLamax, FatMax, thresholds, fuel use and training zones, from a single test in the lab, in the field or fully remote.

