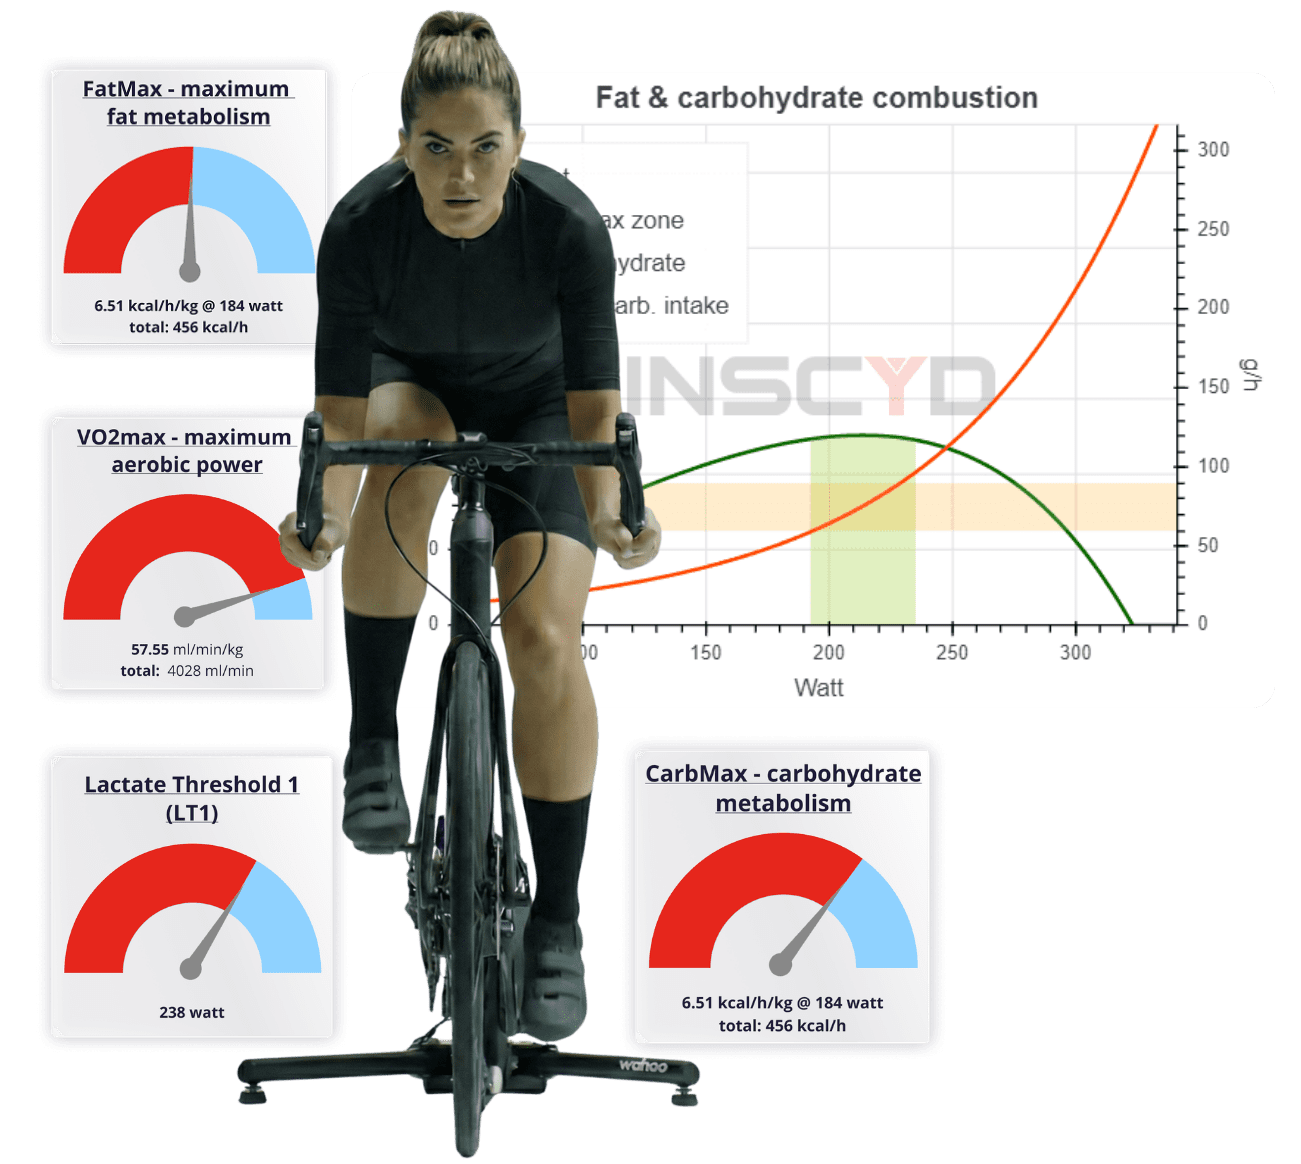
Triathlete lactate tests often miss VLamax assessment, body composition effects, and multi-discipline metabolic profiling, three gaps that limit how much actionable insight coaches can extract from standard incremental tests.
You’ve done these lactate tests countless times. Your triathlete steps onto the treadmill or bike ergometer, and you guide them through a standardized incremental test. Blood lactate is taken at regular intervals, plotted meticulously, and out comes the familiar curve. Based on this, you make individual training recommendations—or compare results to previous tests to evaluate progress.
It’s a well-established routine. In fact, this methodology has been around for nearly 50 years. But in an era where biomedical knowledge is expanding at breakneck speed—and where computing power and data analysis tools have evolved dramatically—should we really still be relying on a 50 year methodology that simply plots raw speed or power against lactate concentration? Wouldn’t we expect that after 50 years of research and evolution there must be a better way to do things?
In this article, we’ll take a deep dive into the three most common—and most overlooked—pitfalls in lactate profile testing for triathletes. And we’ll show you how to avoid them.
Watch our video. You’ll learn how to extract deeper insights from conventional lactate tests using just a handheld meter—and avoid misinterpretation that leads athletes down the wrong training path.
Let’s not forget what athletes are really looking for when they come in for a test. First and foremost: clarity and confidence. They want to leave knowing how to train better—and feel secure that their limited training time is being spent as effectively as possible.
Second, they want relevant benchmarks. Not just numbers on a curve, but data points that actually reflect performance in triathlon.
And third: progress. Did the training they’ve done since the last test lead to meaningful improvements? If so, great—double down. If not, it’s time to rethink the plan.
With a conventional lactate profile test, what do we actually get? Strip away the curve-fitting and threshold guesses, and we’re left with one concrete data point: power or speed at a given lactate concentration. Sure, we can try to interpret lactate curve shifts, shapes, or how deep the athlete pushed—but at the end of the day, it’s still just lactate plotted against external output.
And because this approach is so familiar—so entrenched—it rarely gets questioned. But let’s zoom out for a moment. Independent of any lab protocol, what are the real physiological benchmarks that matter in triathlon?
It’s not lactate concentration itself. What truly determines performance is how efficiently an athlete burns fat, how much glycogen they have in reserve, and how rapidly they burn through carbohydrates at race-specific intensities. These are the metrics that dictate pacing, fueling strategy, and ultimately, race-day performance.
And yet—none of this is captured by a conventional lactate test.

Let’s say you run a standard lactate test on a triathlete and measure a concentration of 4.1 mmol/L at a given power output. That number looks objective. Clean. Reliable. But here’s the catch: lactate is measured in millimoles per liter—and almost no one ever stops to ask liters of what?
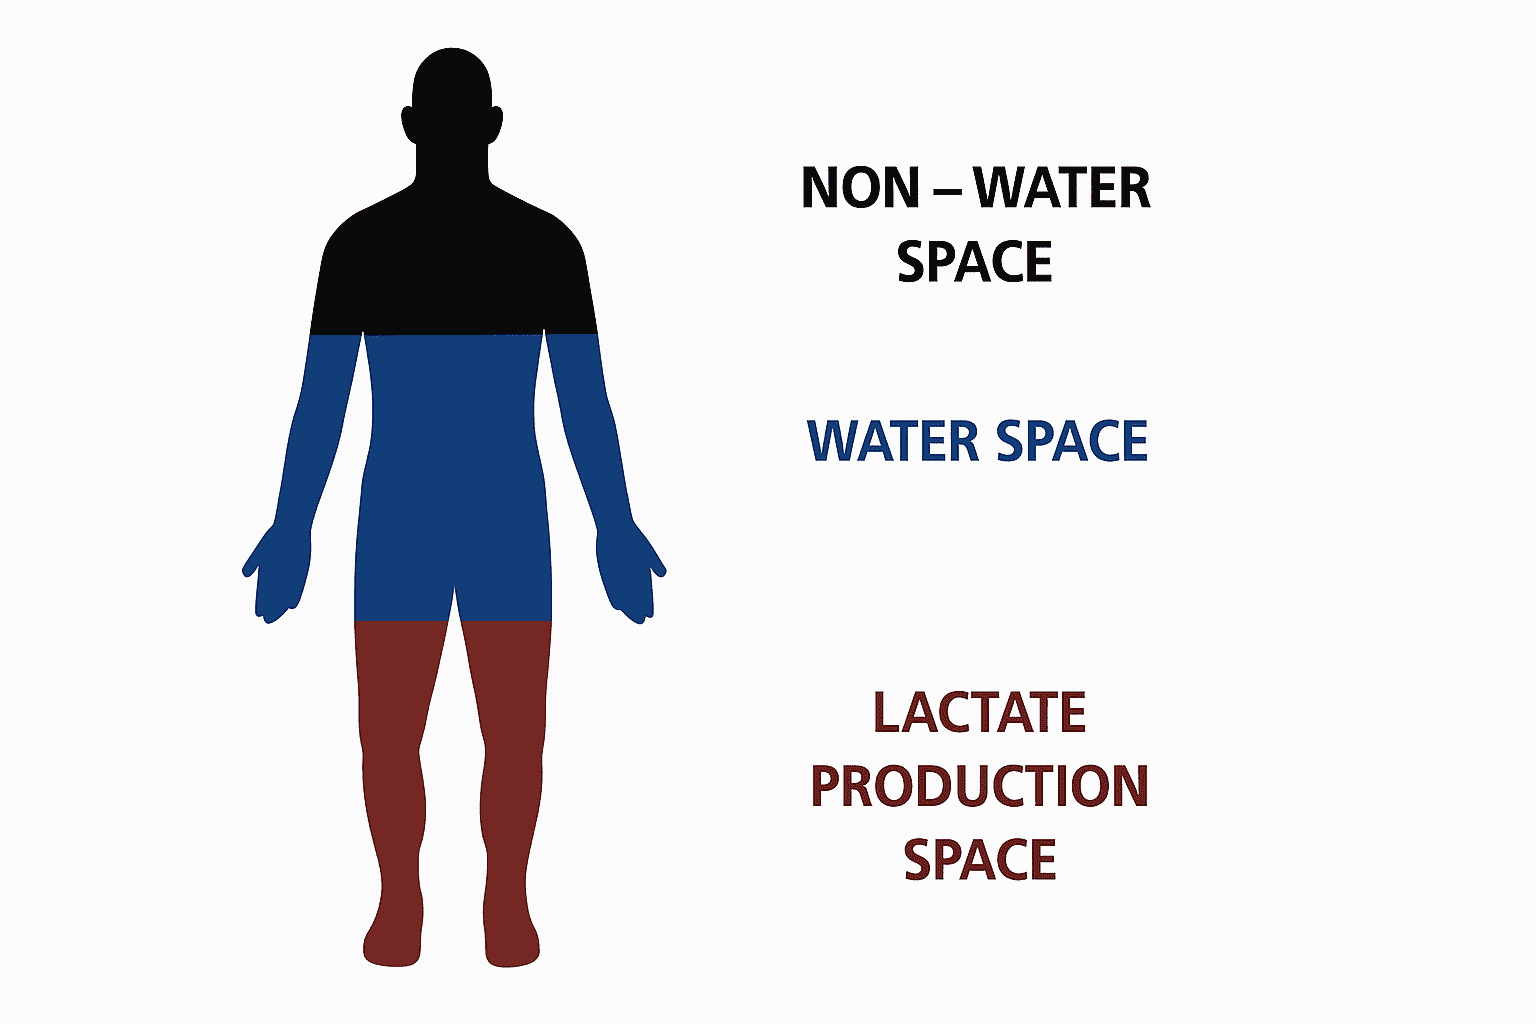
Lactate doesn’t just float in space. It dilutes in the water compartments of the body—primarily in blood, organs, muscle and interstitial fluid. And here’s the problem: the total volume of that dilution space can change, especially in athletes who shift body composition through training. More muscle mass means more water. And more water means a larger dilution space.
Here’s how that plays out: imagine an example male triathlete, 70kg, 15% body fat, has around 18 kg of leg muscle actively working during a cycling test. At a given intensity, those muscles accumulate 135 mmol of lactate during the duration of that load increment of 5 minutes. If that lactate is diluted in 33 liters of body water, we get a concentration of 4.1 mmol/L. Straightforward.
But now imagine the same athlete spends a training block focused on swimming. He adds upper-body muscle—muscle that isn’t used in the cycling test, but still adds water to his body.
His physiology and performance on the bike hasn’t changed at all, but his total dilution space increases from 33 to 36 liters. Run the same test, and what do you get?
135 mmol of accumulated lactate but now divided by 36 liters = 3.7 mmol/L. The Lactate profile curve would shift to the right!
Same workload. Same Performance. Same Physiology. Same lactate accumulation in the working muscle. Different concentration—simply because the “pool” got bigger.
So what looks like improved cycling performance—a lower lactate at the same power—isn’t real progress. It’s just dilution. And because most testing protocols don’t account for body composition—or even consider how much muscle is involved in the test—it’s easy to draw the wrong conclusion.
To make matters worse, most lactate threshold concepts were validated in male cohorts with relatively consistent body composition. Apply those same assumptions to female athletes—or to athletes who shift muscle mass between tests, or age group athletes with a higher body fat percentage—and you’re working with a flawed lens from the start.
If you’re not accounting for dilution space, you’re not measuring adaptation. You’re measuring how full the bathtub is—without checking how big the tub actually is.
Athletes don’t come in for testing just to see numbers. They want reassurance. They want to know their training is working—that the long hours are pushing them toward their goal, not away from it.
Coaches and physiologists want the same: confidence that the plan is right and the athlete is progressing. And the most common way to check this? Look at whether the lactate curve shifted to the right.
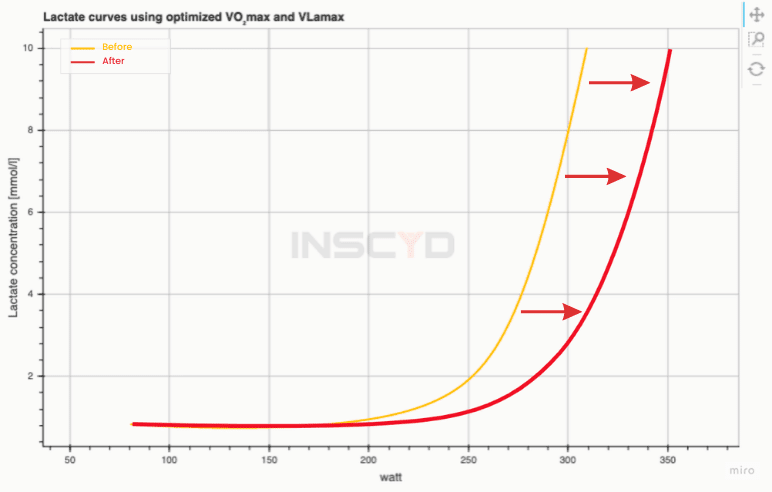
But here’s the uncomfortable truth: that shift might be a lie.
Lactate concentration at any point during the test is the result of two opposing forces:
You can lower lactate concentration by producing less, or by burning more. Simple. But the conventional test doesn’t tell you which one happened. It only shows the result.
That matters—a lot. Say an athlete does months of low-intensity aerobic training. Their VO2max improves (a huge win). But, especially if the training done previously consisted also of some higher intensity training, now by turning to low intensity only the athlete might not recruit and thereby train those intermediate type muscle fibers anymore. These fibers lose their aerobic capacity and become more glycolytic.
More lactate is produced because of this, more is burned because of the improved aerobic capacity… yet the changes cancel out, and the curve doesn’t move. A coach might wrongly assume the training failed, when it actually improved the single most important performance metric – the VO2max of the athlete.
Or flip it: an athlete cuts volume, and both glycolytic and aerobic systems decline. But if lactate production dropped more than combustion? The lactate curve shifts to the right. It looks like progress. And now the coach draws the exact wrong conclusion: let’s keep going down this path. When in reality, the athlete’s endurance engine is shrinking.
And here’s the scary part: this isn’t theory. We’ve seen it happen to elite athletes—across sports and countries we are working with, athletes who followed the wrong signal from a lactate test. Not once, but over months or years. Each test reinforced a false narrative. Each training block is built on a mistaken belief. Until performance started slipping—and no one knew why.
If you’re using the lactate curve to track progress, but not understanding why it shifted, you’re flying blind.
So where does this leave us? If conventional lactate testing leaves us flying blind, what’s the alternative?
The good news is: you don’t need new equipment. You don’t need a metabolic cart. You don’t even need to change your protocol.
With INSCYD, all it takes is 3–4 well-chosen efforts—like the incremental lactate profile test you’re already doing. But instead of stopping at raw concentration values, we apply cutting-edge physiological modeling and mathematical analysis to decipher what really happened under the hood.
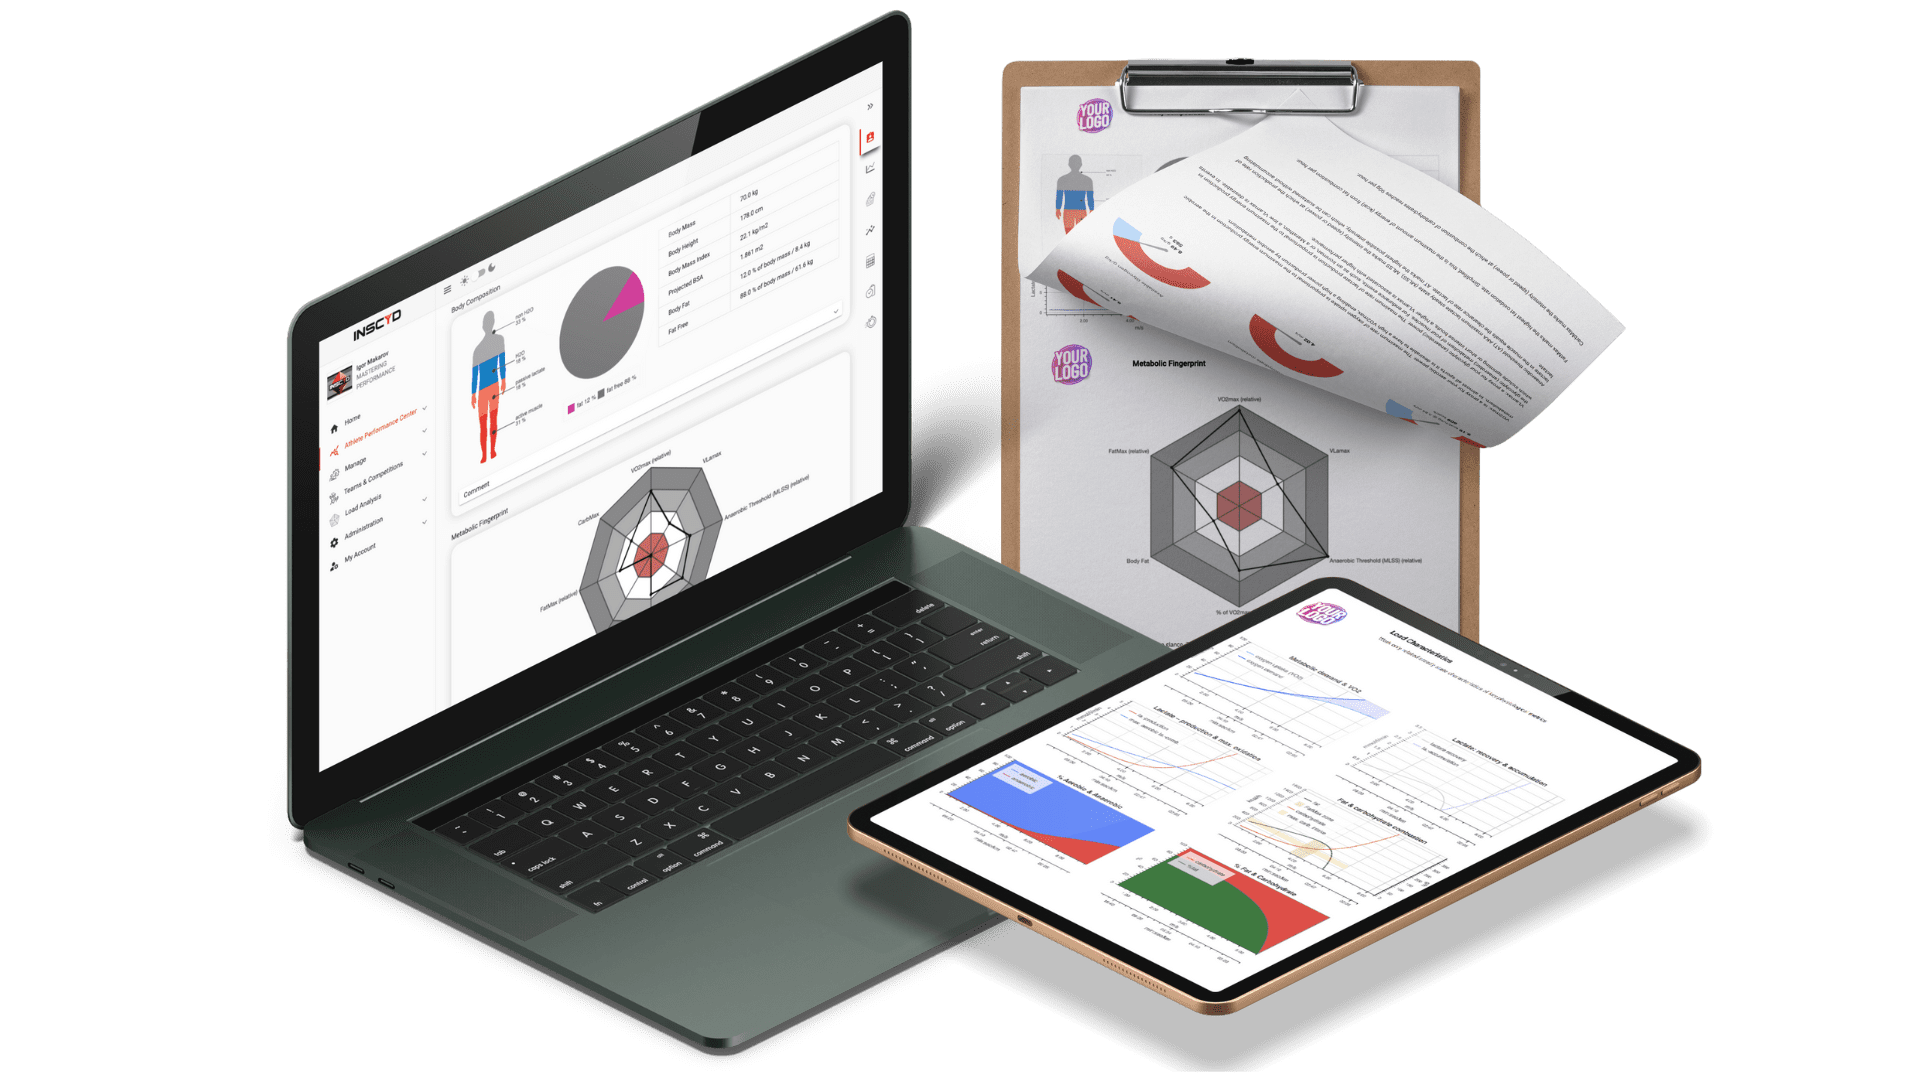
We break down the lactate concentration into its two root causes: production (via glycolysis) and combustion (in aerobic metabolism). You can finally understand why the curve shifted, not just if it did.
We also ask for one small, but crucial detail: body fat percentage. That lets us calculate the actual dilution space—the size of the “bathtub” your lactate is floating in—so you can interpret changes in concentration with scientific accuracy.
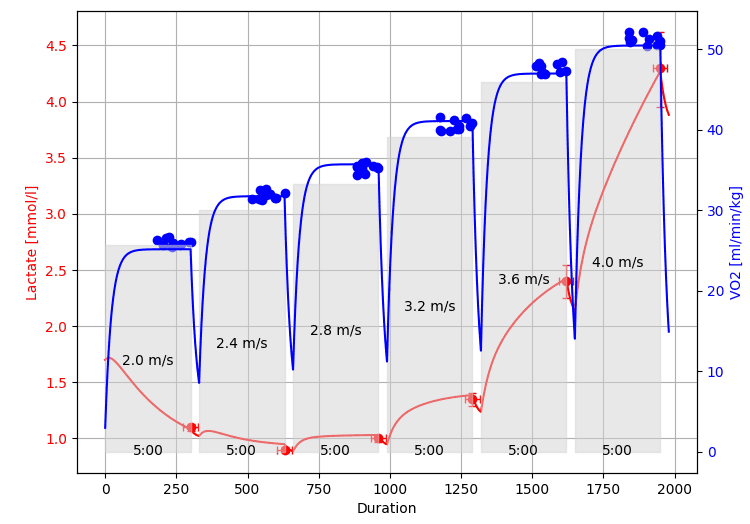
And here’s where it gets exciting. Because lactate combustion is proportional to oxygen use, we can also reverse-engineer actual VO2 values—including VO2max. That’s right: validated by peer-reviewed studies, this approach provides lab-grade VO2max values without a gas analyzer. No cumbersome metabolic carts. No six-figure lab setups. Just smart math and solid science.
But we don’t stop at oxygen.
Remember how we said carbohydrate and fat metabolism matter more than lactate for triathletes?
That’s exactly what we reveal. Lactate production is directly tied to carbohydrate usage and regulation of fat combustion (3)—so from that, we calculate carbohydrate combustion and fat combustion rates in grams per minute. Want to dial in race fueling? Now you can. Want to know FatMax—the intensity where fat burning peaks—and build training zones around it? We give you that too. Because when you know oxygen uptake, power output, and carb usage, you also know total energy expenditure—and from there, fat oxidation becomes fully visible.
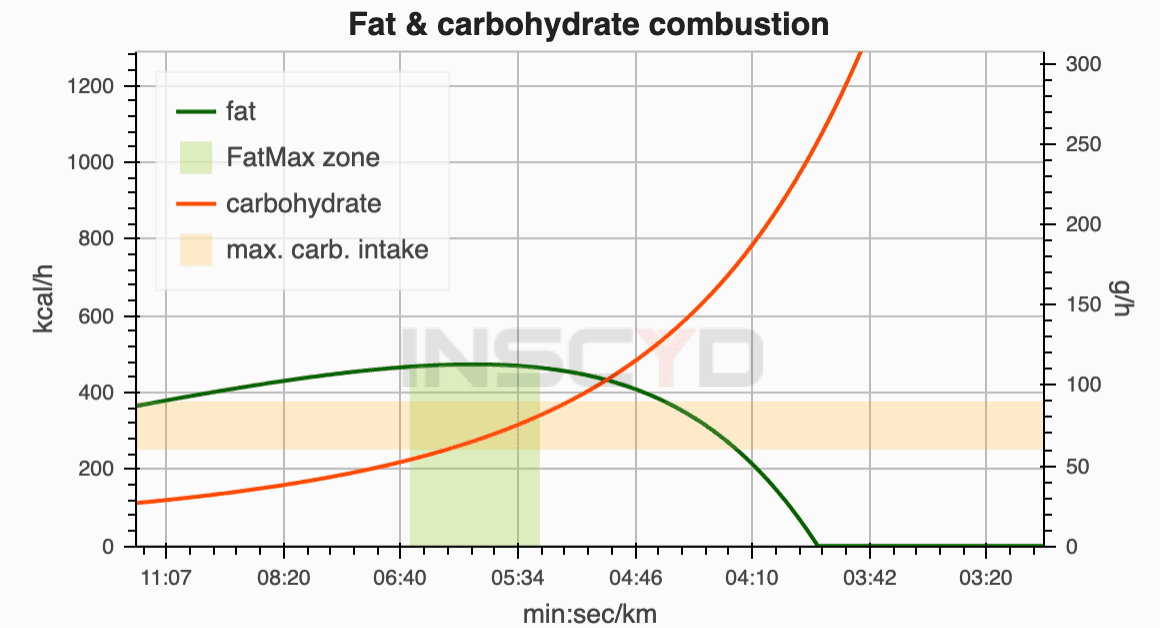
All of this:
✅ Built on modern exercise physiology
✅ Backed by independent, peer-reviewed science
✅ Delivered through conventional test protocols you already use
It’s time to move beyond the 50-year-old habit of plotting lactate against workload. With INSCYD, you turn that simple lactate test into a complete metabolic fingerprint—so you can train smarter, fuel smarter, and track progress with confidence.
Science has evolved. It’s time your testing does too.
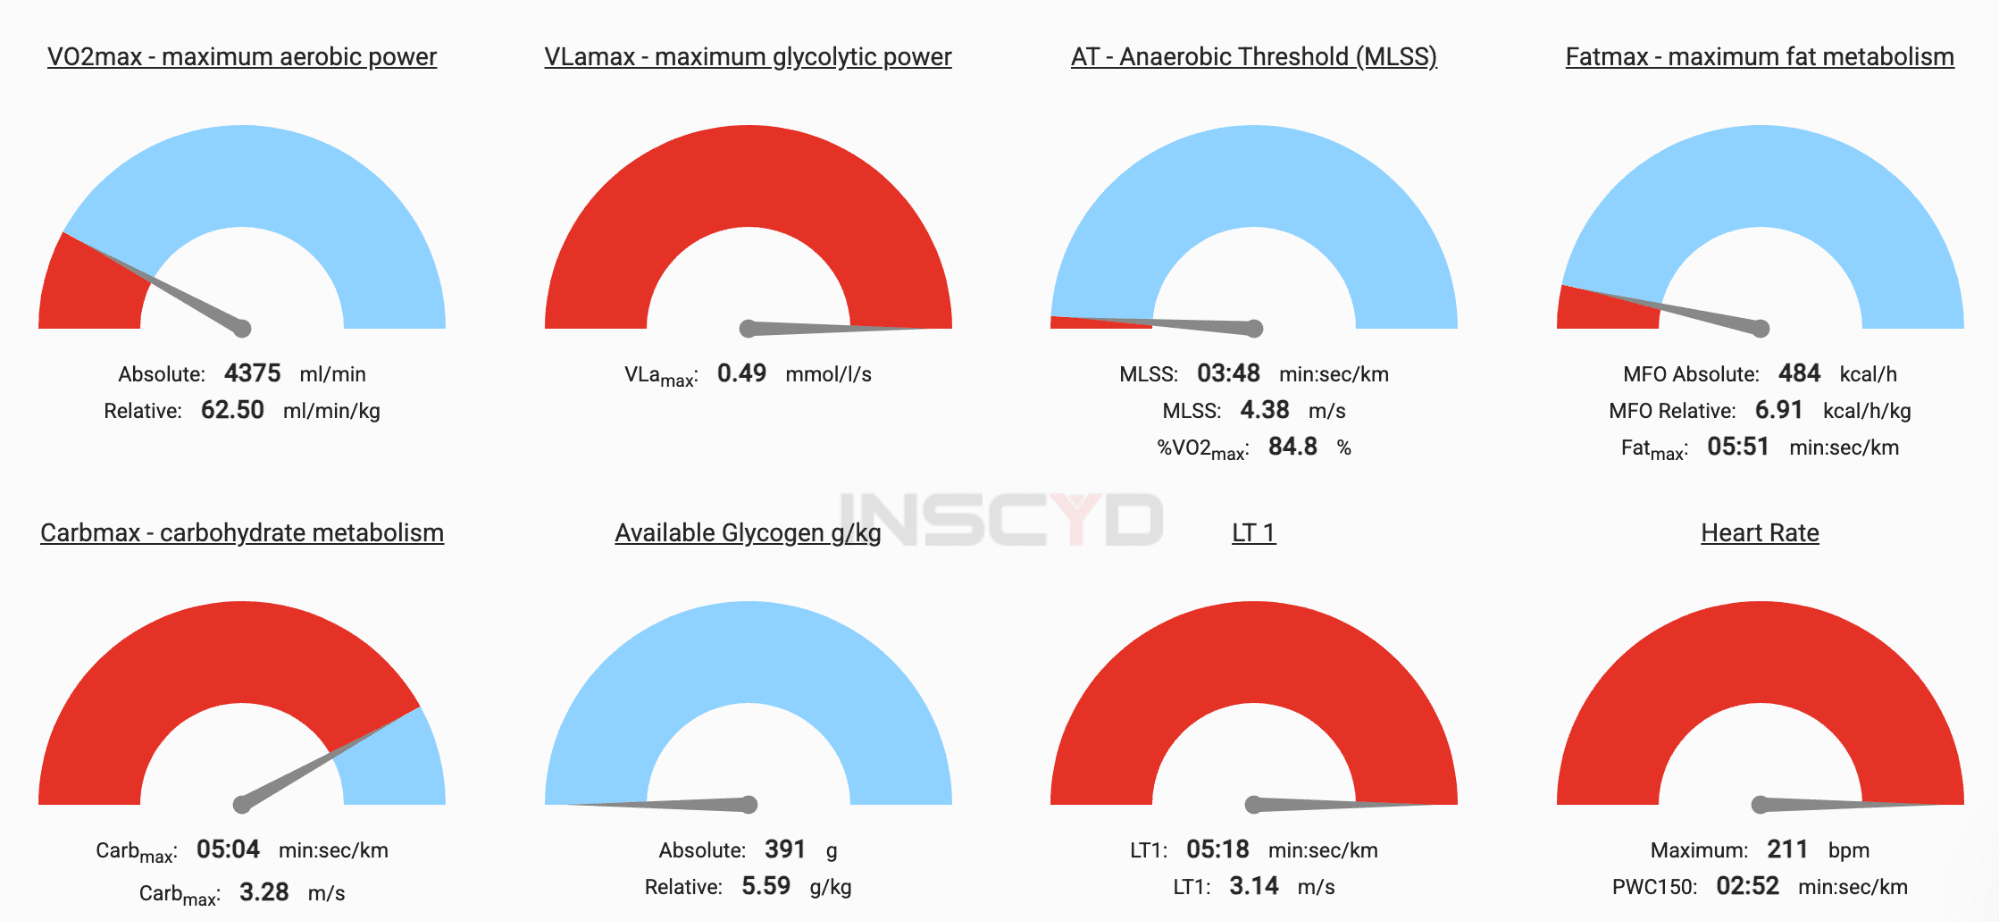
Ready to begin? If you’re not yet using INSCYD, book a free demo to take the first step toward integrating physiology-based training into your performance testing and coaching.
And if you’re an athlete, find an INSCYD-certified coach or lab.
Stop guessing. Start using real physiological data to individualize your clients training and drive consistent progress.
Brooks, G. A. “Lactate: glycolytic end product and oxidative substrate during sustained exercise in mammals—the “lactate shuttle”.” Circulation, respiration, and metabolism: current comparative approaches. Berlin, Heidelberg: Springer Berlin Heidelberg, 1985. 208-218.
Rogatzki, M. J., Ferguson, B. S., Goodwin, M. L., & Gladden, L. B. (2015). Lactate is always the end product of glycolysis. Frontiers in neuroscience, 9, 22.
Brooks, George A. “Lactate as a fulcrum of metabolism.” Redox biology 35 (2020): 101454.
Ohr, Carmen, and Ralf Lindschulten. (2023) “Load intensity determination in long-distance triathlon with INSCYD athletic performance software.” Sport Perf Sci 196.
VO₂max, VLamax, FatMax, thresholds, fuel use and training zones, from a single test in the lab, in the field or fully remote.

