A national swimmer underperforms vs her teammate despite similar lactate levels, this case study shows how VLamax comparison, not VO2max alone, reveals the real physiological gap and corrects the training plan.
This case study is about an 800 meter National Swimmer who is not able to keep up with her teammate during training and racing. Observations and lactate measurements seem to indicate she needs to improve her aerobic energy system, but this turns out to be a false assumption. Read the article and register for the Swimming webinar via this link.
A National Coach works with two 800 meter freestyle swim athletes, who both compete at the highest level. According to the coach, athlete A has a significantly higher aerobic performance (VO2max) than athlete B.
The difference between the athletes become very clear during training and racing.
A conventional lactate test seems to confirm the assumption of the coach, that athlete A indeed has a higher aerobic capacity than athlete B. The lactate curves of the two 800 meter athletes differ significantly.
Here are the results of the lactate step test (7x200m), performed in a 50m pool:
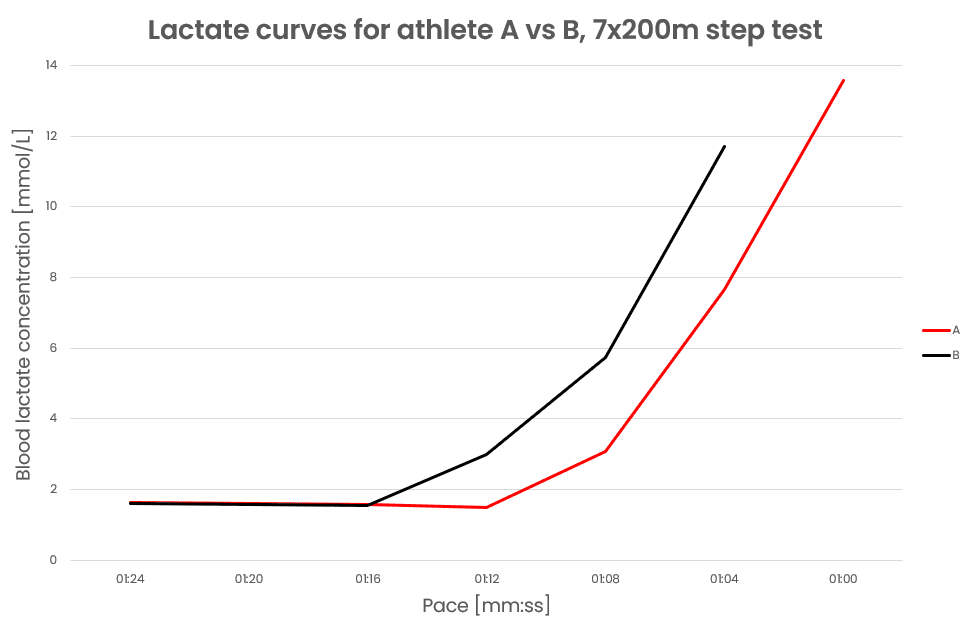
You can easily see that athlete A has a lactate curve that is shifted to the right. For many coaches, this would be enough to conclude that athlete A indeed has a better aerobic base or aerobic capacity (VO2max).
What we know:
A potential conclusion based on this input:
A corresponding practical implication:
To better understand the (aerobic) physiological differences between the two athletes, the coach decides to use the INSCYD software. It all starts with a swim specific performance test.
To get a full 360 metabolic profile, you need to first perform an exercise test. INSCYD is known for the wide possibilities in test protocols. Here’s the protocol that was used in this specific case study:
Before the examination, the weight and body composition were determined. These values, just like gender, are included in the INSCYD analysis.
The protocol in detail:
Blood lactate was measures before and after each interval. VO2 data was collected after each interval and used to understand the VO2 during the effort via backward extrapolation of the VO2 kinetics.
As shown, INSCYD enables you to combine different swim techniques (e.g. freestyle and backstroke) as well as different pool lengths within one performance assessment. This results in further advantages in diagnostics. You can for instance quantify movement economy (the energy expenditure in relation to the speed) in different swim techniques.
Learn more about assessing the physiological (metabolic) performance determinants in swimming via our webinar.
Here are the metrics you can get when performing an INSCYD test:
Maximum aerobic power.
Maximum glycolytic power.
Maximum lactate steady state & maximum metabolic (VO2) steady state.
In all-out efforts.
Energy expenditure expressed in oxygen demand as a function of speed. Available for different technique.
At any given exercise intensity, in steady state conditions.
At any given exercise intensity, in steady state conditions.
At any given exercise intensity, in steady state and non-steady state conditions
Remember we said it would make sense to conclude that athlete A is aerobically stronger than athlete B? Here are the facts:
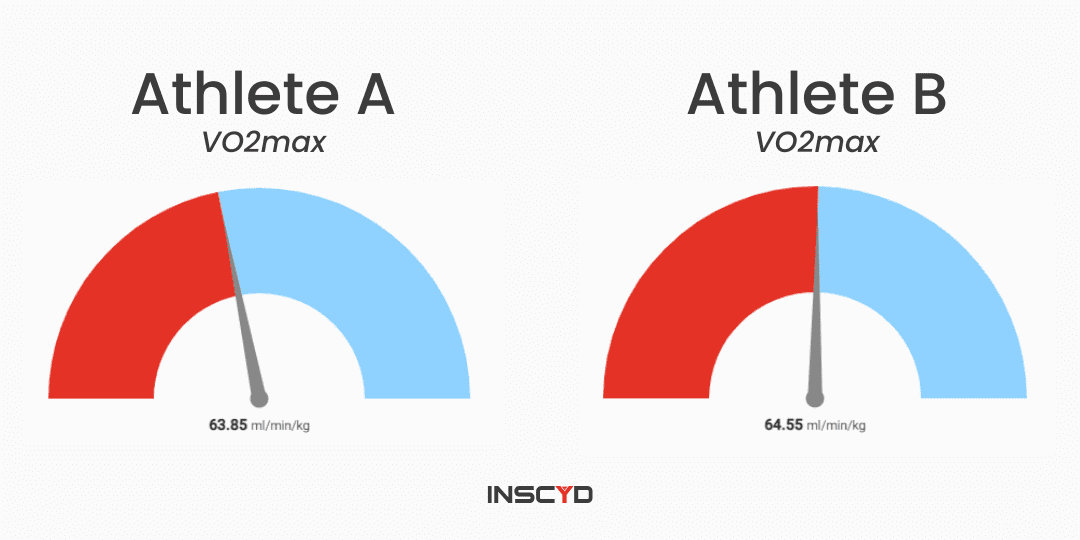
Athlete A has a VO2max of 63.85 ml/min/kg, with a body weight of 72.4 kg.
Athlete B has a VO2max of 64.55 ml/min/kg, with a body weight of 71.1 kg.
In other words, contrary to what you might expected, athlete B has a slightly higher VO2max. How come these results contradict what many coaches would assume? Let’s continue looking at the results.
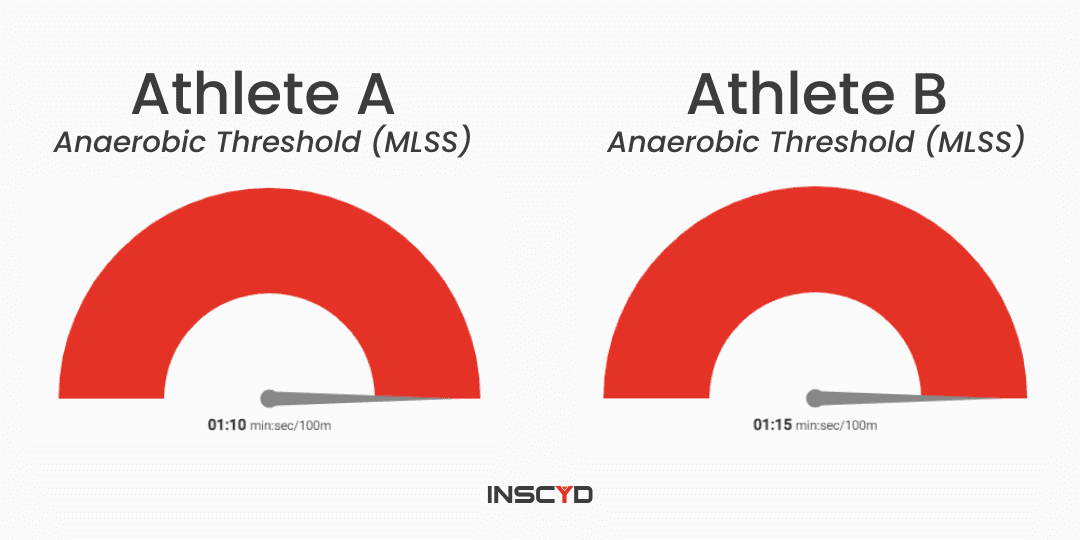
Athlete A has a MLSS at 1:10 min:sec/100m
Athlete B has a MLSS at 1:15 min:sec/100m
This seems to confirm A has a better aerobic engine, which we know is not true..
As mentioned in the protocol section, both VO2 and lactate samples were collected during the test. By combining these two markers for aerobic metabolism and anaerobic metabolism, you get the total energy demand. If you compare the energy demand with the swim speed, you get the economy.
If swimmer A is able to swim faster with less energy, that would explain why she is faster while having a lower VO2max. This could be the case when her swim technique is (much) better.
Although swimming economy is often overlooked, it is not what differentiates our two 800 meter freestyle swimmers.
Figure 4 shows the economy of athlete A (red) and athlete B (black). The bars show how much faster or slower the athlete goes compared to a control group, based on energy expenditure. In other words: if your bar is above 0 (which they all are), you go faster with a given energy expenditure. This means your economy is better than the control group. If your bar is below 0, you go slower with a given energy expenditure. This means your economy is worse than the control group.
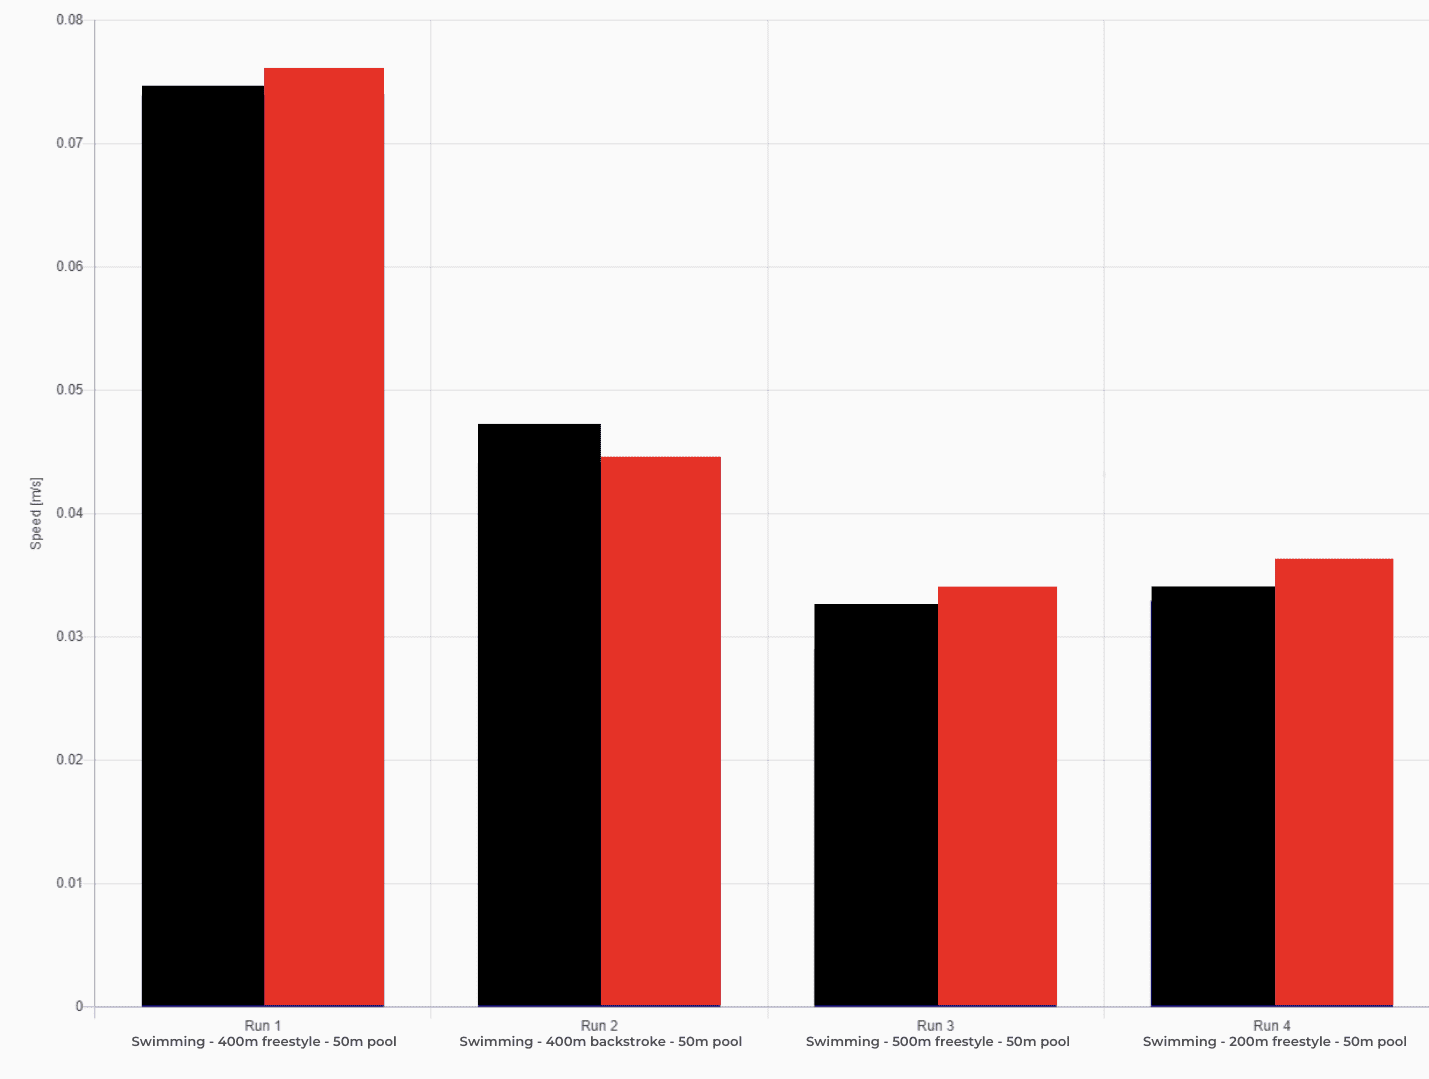
Their swim economy is very similar. Which means we still didn’t find what we’re looking for.
The INSCYD results show that – at the same speed – athlete A has a significantly higher energy contribution from the aerobic energy system, compared to athlete B (Fig. 5). At a speed of 01:00 min:sec/100m, for example, the aerobic energy contribution for athlete A is around 74% (solid blue line), while the aerobic energy contribution for athlete B is only 67% (dashed blue line).
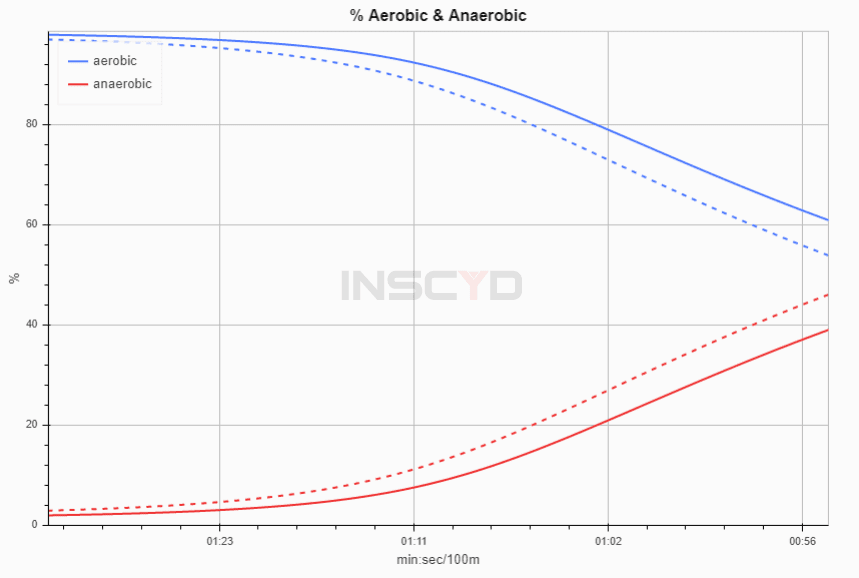
It is easy to see that at a speed above 1:11 min:sec/100m, athlete B can produce significantly less energy via the aerobic metabolism than athlete A. This again seems to confirm A has a better aerobic engine, which is contradicted by the VO2max values.
Let’s continue our search. Hang on!
Figure 6 shows why athletes A and B perform very different in competition and training. Let’s look what happens at a speed of 1:08 min:sec/100m. Athlete A accumulates approx. 0.65 lactate per mmol/L/min. After 15 minutes, she would have a lactate concentration of about 11 mmol/L. Athlete B, on the other hand, accumulates 1.82 mmol/l lactate per minute at this speed. She would be exhausted in less than 6 minutes.
We see a similar pattern when it comes to the ability to “clear” (recover from) lactate. Athlete A can already recover from a previous lactate accumulation at 1:12 min:sec/100m. At this intensity, she can clear about 0.15 mmol/l per minute. Athlete B on the other hand, still accumulates approx. 0.65 mmol/l/min lactate at this level of intensity. This means she would not be able to recover at all, but instead continue to accumulate lactate.
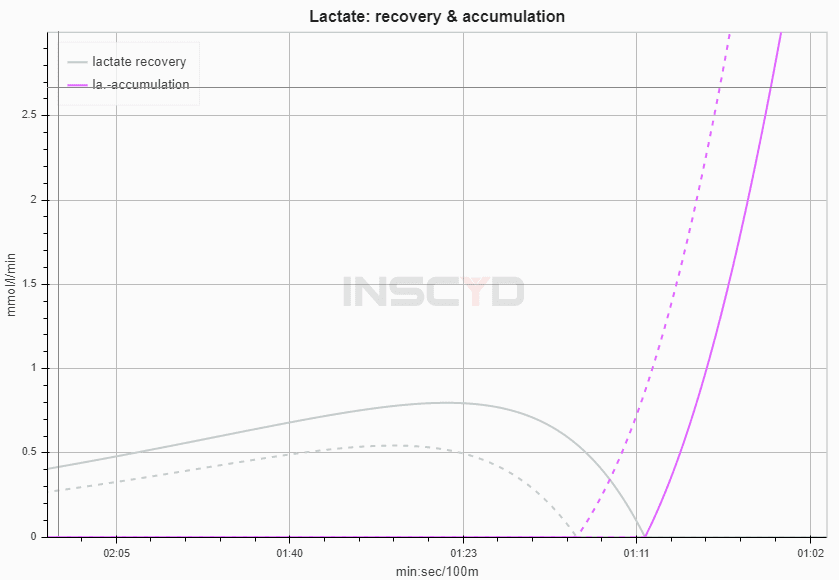
When VO2max and economy are very similar, but energy contribution and lactate dynamics are very different, there’s only one piece of the puzzle left. Our 2 athletes must differ significantly in terms of their glycolytic performance.
Athlete A has a VLamax of 0.35 mmol/l/s.
Athlete B has a VLamax of 0.76 mmol/l/s.
This finally explains why the lactate curves in the beginning of this article look significantly different, while VO2max is very similar.
We see athlete B is superior to athlete A in terms of glycolytic performance.
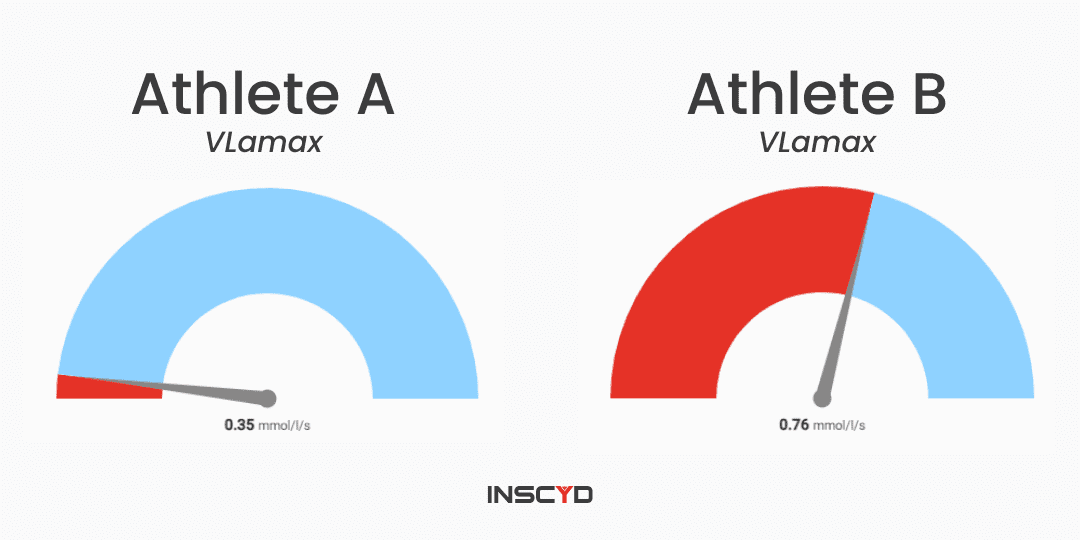
But wait, how is it possible that athlete B’s swimming performance is inferior, while her (anaerobic) energy system is superior?
The glycolytic energy system produces energy fast. Therefore, on the one hand, a high VLamax increases the energy available for short efforts like a 200m swimming race.
However, the glycolytic energy system also produces lactate. Therefore, on the other hand, a high VLamax increases lactate accumulation rate and decreases time until fatigue. It also decreases the anaerobic threshold and increases recovery time from hard efforts – as we’ve seen in the previous graphs and metrics.
This is a disadvantage in longer swim efforts like the 800 meter freestyle.
Learn more about VLamax via this article and download the whitepaper.
If we had only compared the lactate concentration curves of a conventional lactate step test, we would have easily concluded that athlete A has a better aerobic engine than athlete B. We would tell athlete B to focus on increasing the aerobic energy system.
The 360 metabolic profile from INSCYD shows that this approach is based on false assumptions. It showed that athlete B even has a slightly higher aerobic performance than athlete A and a very similar swimming economy. Instead, the real cause of athlete B’s underperformance is the VLamax: it’s too high.
Without the INSCYD report, athlete B would spend a lot of time trying to increasing her aerobic performance and waste precious time. With the knowledge of INSCYD, she now knows what would effectively increase her performance: a training plan that decreases VLamax.
In this case study, we confirmed the observation of the coach that athlete A is better in training and racing. However, the reason turned out to be not about aerobic performance, but anaerobic performance.
Register for our webinar to learn more about physiological (metabolic) performance determinants in swimming. We’ll learn which metrics to look for and how to assess them.
VO₂max, VLamax, FatMax, thresholds, fuel use and training zones, from a single test in the lab, in the field or fully remote.

