Should my Track and Field runner increase or decrease VLamax?
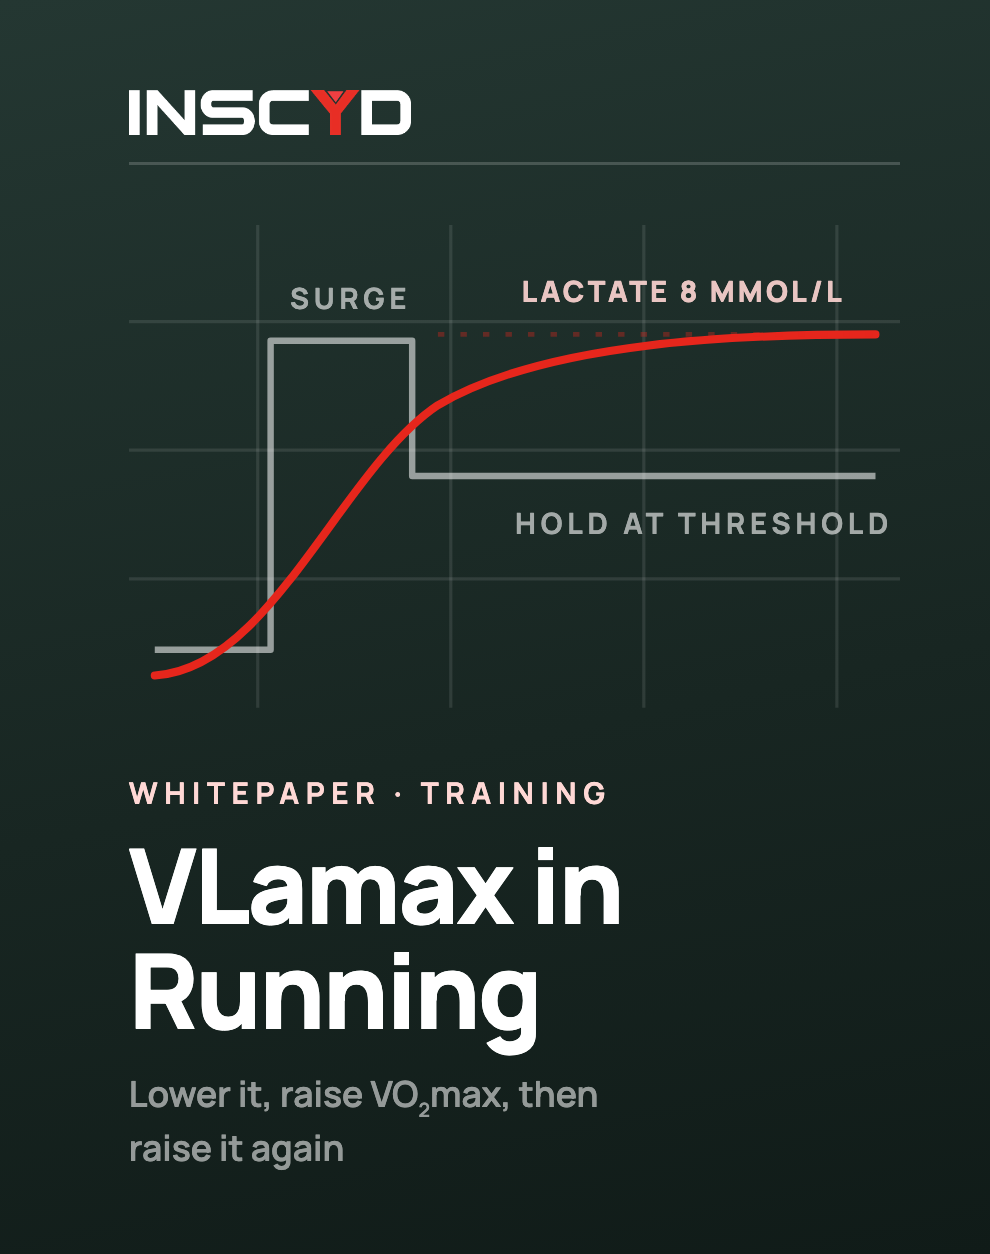
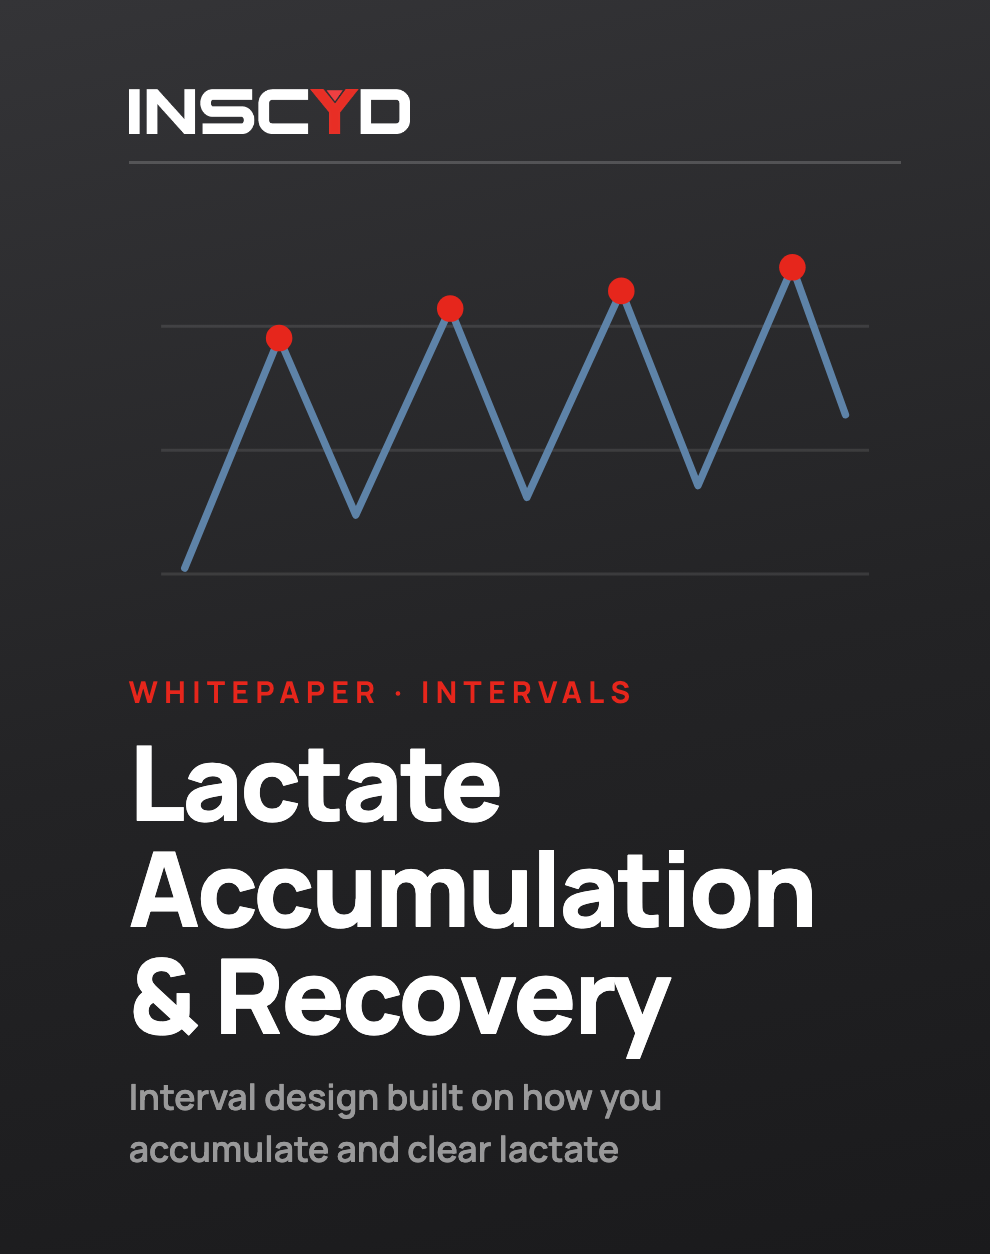
Most distance runners carry a VLamax that is too high, but lowering it also lowers fatigue resistance. How to read the lactate accumulation and recovery chart and decide per athlete and per race distance. The whitepaper adds the worked examples.
Fill a short form, we email you the PDF right away.
Why most distance runners sit too high
Gym work, school speed work and fast 400 m repeats with long rests all raise VLamax. Most athletes racing a mile or more benefit from lowering it.
Why you should not always lower it
A lower VLamax also lowers the maximal lactate concentration an athlete tolerates. Accumulation slows, but fatigue resistance drops with it. The decision has to weigh both.
Reading the accumulation and recovery chart
The accumulation rate above threshold times race duration gives the finishing lactate concentration. Compare it with the athlete’s measured maximum and you know whether a target pace is realistic before the gun goes off.
From projection to state record
Performance Projection shows what a 5% change in VO₂max or VLamax does to race time. One athlete went from 2:09 to a 2:06.5 state record in five weeks by training exactly the metric it flagged.
About this whitepaper
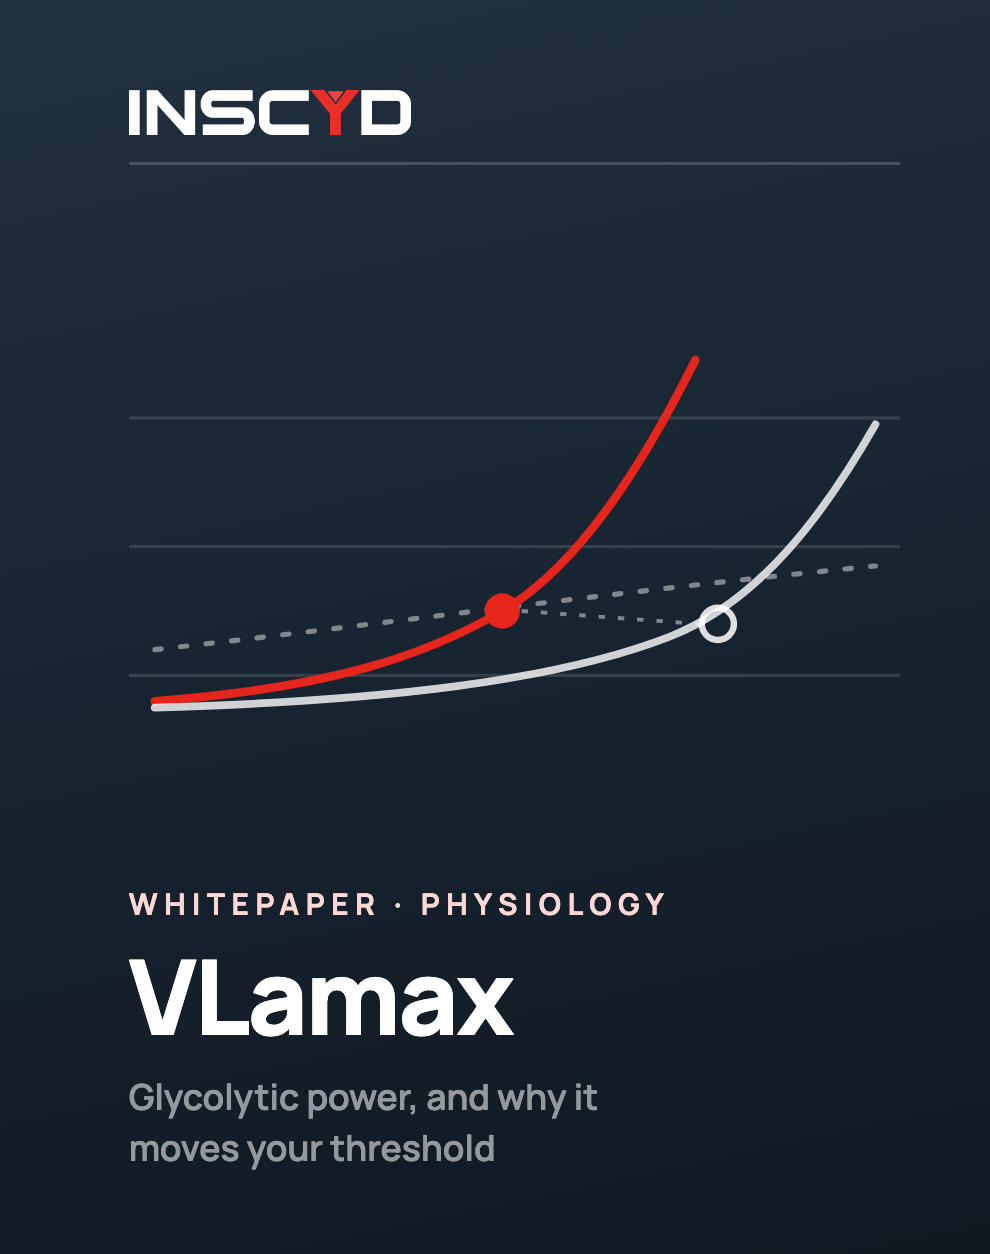
In our previous article about Why the best track and field running coaches look beyond VO2max, we talked about the importance of knowing your athlete’s anaerobic power (VLamax). We showed that having a too low VLamax can easily cost you more than 5 seconds in an 800m race, while a too high VLamax can cost more than 140 seconds in a 5k race. That leaves us with the question: what is a good VLamax? and How do you know if you need to increase or decrease your VLamax?
VLamax is often called the anaerobic (or better: glycolytic) brother of VO2max. You can easily determine your athlete’s (anaerobic) glycolytic power or VLamax with an INSCYD test. This test only requires a GPS watch, but you can add lactate and/or VO2 data if you would like to. Learn more about the INSCYD test (protocols) via this link.
Once you know the VLamax of your athlete, you probably wonder: is this a good number? As mentioned in our previous article: when it comes to VLamax, it’s not the higher the better. In fact, National and State Champion coach in track and field and XC, Ben Tilus found that most high school track and field athletes in race distances of a mile or more will benefit from lowering their VLamax.
Why Most Distance Runners Benefit From Lowering VLamax
When I started working with INSCYD I realized: if you just lower the athlete’s VLamax, they’re going to get faster in longer events. That’s because most distance runners have a VLamax that is too high.
How is it possible that a better anaerobic energy system can cause poorer performance?
The anaerobic energy system – or better: glycolytic energy system – produces:
Energy by using glucose
Fuel for the aerobic energy system
Every time it produces energy, it also produces fuel for the aerobic energy system. This fuel is called lactate (hence VLamax, the anaerobic brother of VO2max, with: V = volume ; La = lactate ; max = maximum production).
When the anaerobic energy system is super active, it can produce more fuel than the aerobic energy system is able to use. The fuel (lactate) will accumulate.
While that itself is not a problem, the side effects will eventually cause fatigue.
That’s why a highly developed anaerobic energy system can make your athlete run slower. Even though it’s a system that produces energy.
Many distance track and field athletes have a VLamax that is too high because they are used to doing training sessions that increase VLamax, like:
Going to the gym and lifting weights
Do a lot of speed work at their schools
Very common interval sessions of fast 400 meter repeats
They’re taking long rest in between intervals
They’re sprinting a lot because it’s fun and coaches assume “it’s a good workout”
Since they often have these high VLamax values, most runners benefit from lowering their VLamax. As a result, I first thought: why wouldn’t I always want to lower VLamax, since it seems like they get faster at every pace?
Why You Should Not Always Want To Lower VLamax
Then I found out in a discussion with Sebastian Weber (INSCYD project lead) that lowering VLamax also meant that they lower the maximal lactate concentration at which they fatigue and stop performing at their best.
In other words: lowering VLamax decreases the rate at which an athlete accumulates lactate and fatigue, but it also decreases their “fatigue resistance”.
And that’s something you have to factor in when finding the best VLamax.
How Do You Know If You Need To Increase Or Decrease VLamax
To find out whether athletes would benefit from increasing or decreasing their VLamax, I start with looking at the lactate accumulation and recovery chart. This enables me to find out what my athletes are capable of in any given race.
Predict Race Performance With The Lactate Accumulation & Recovery Graph
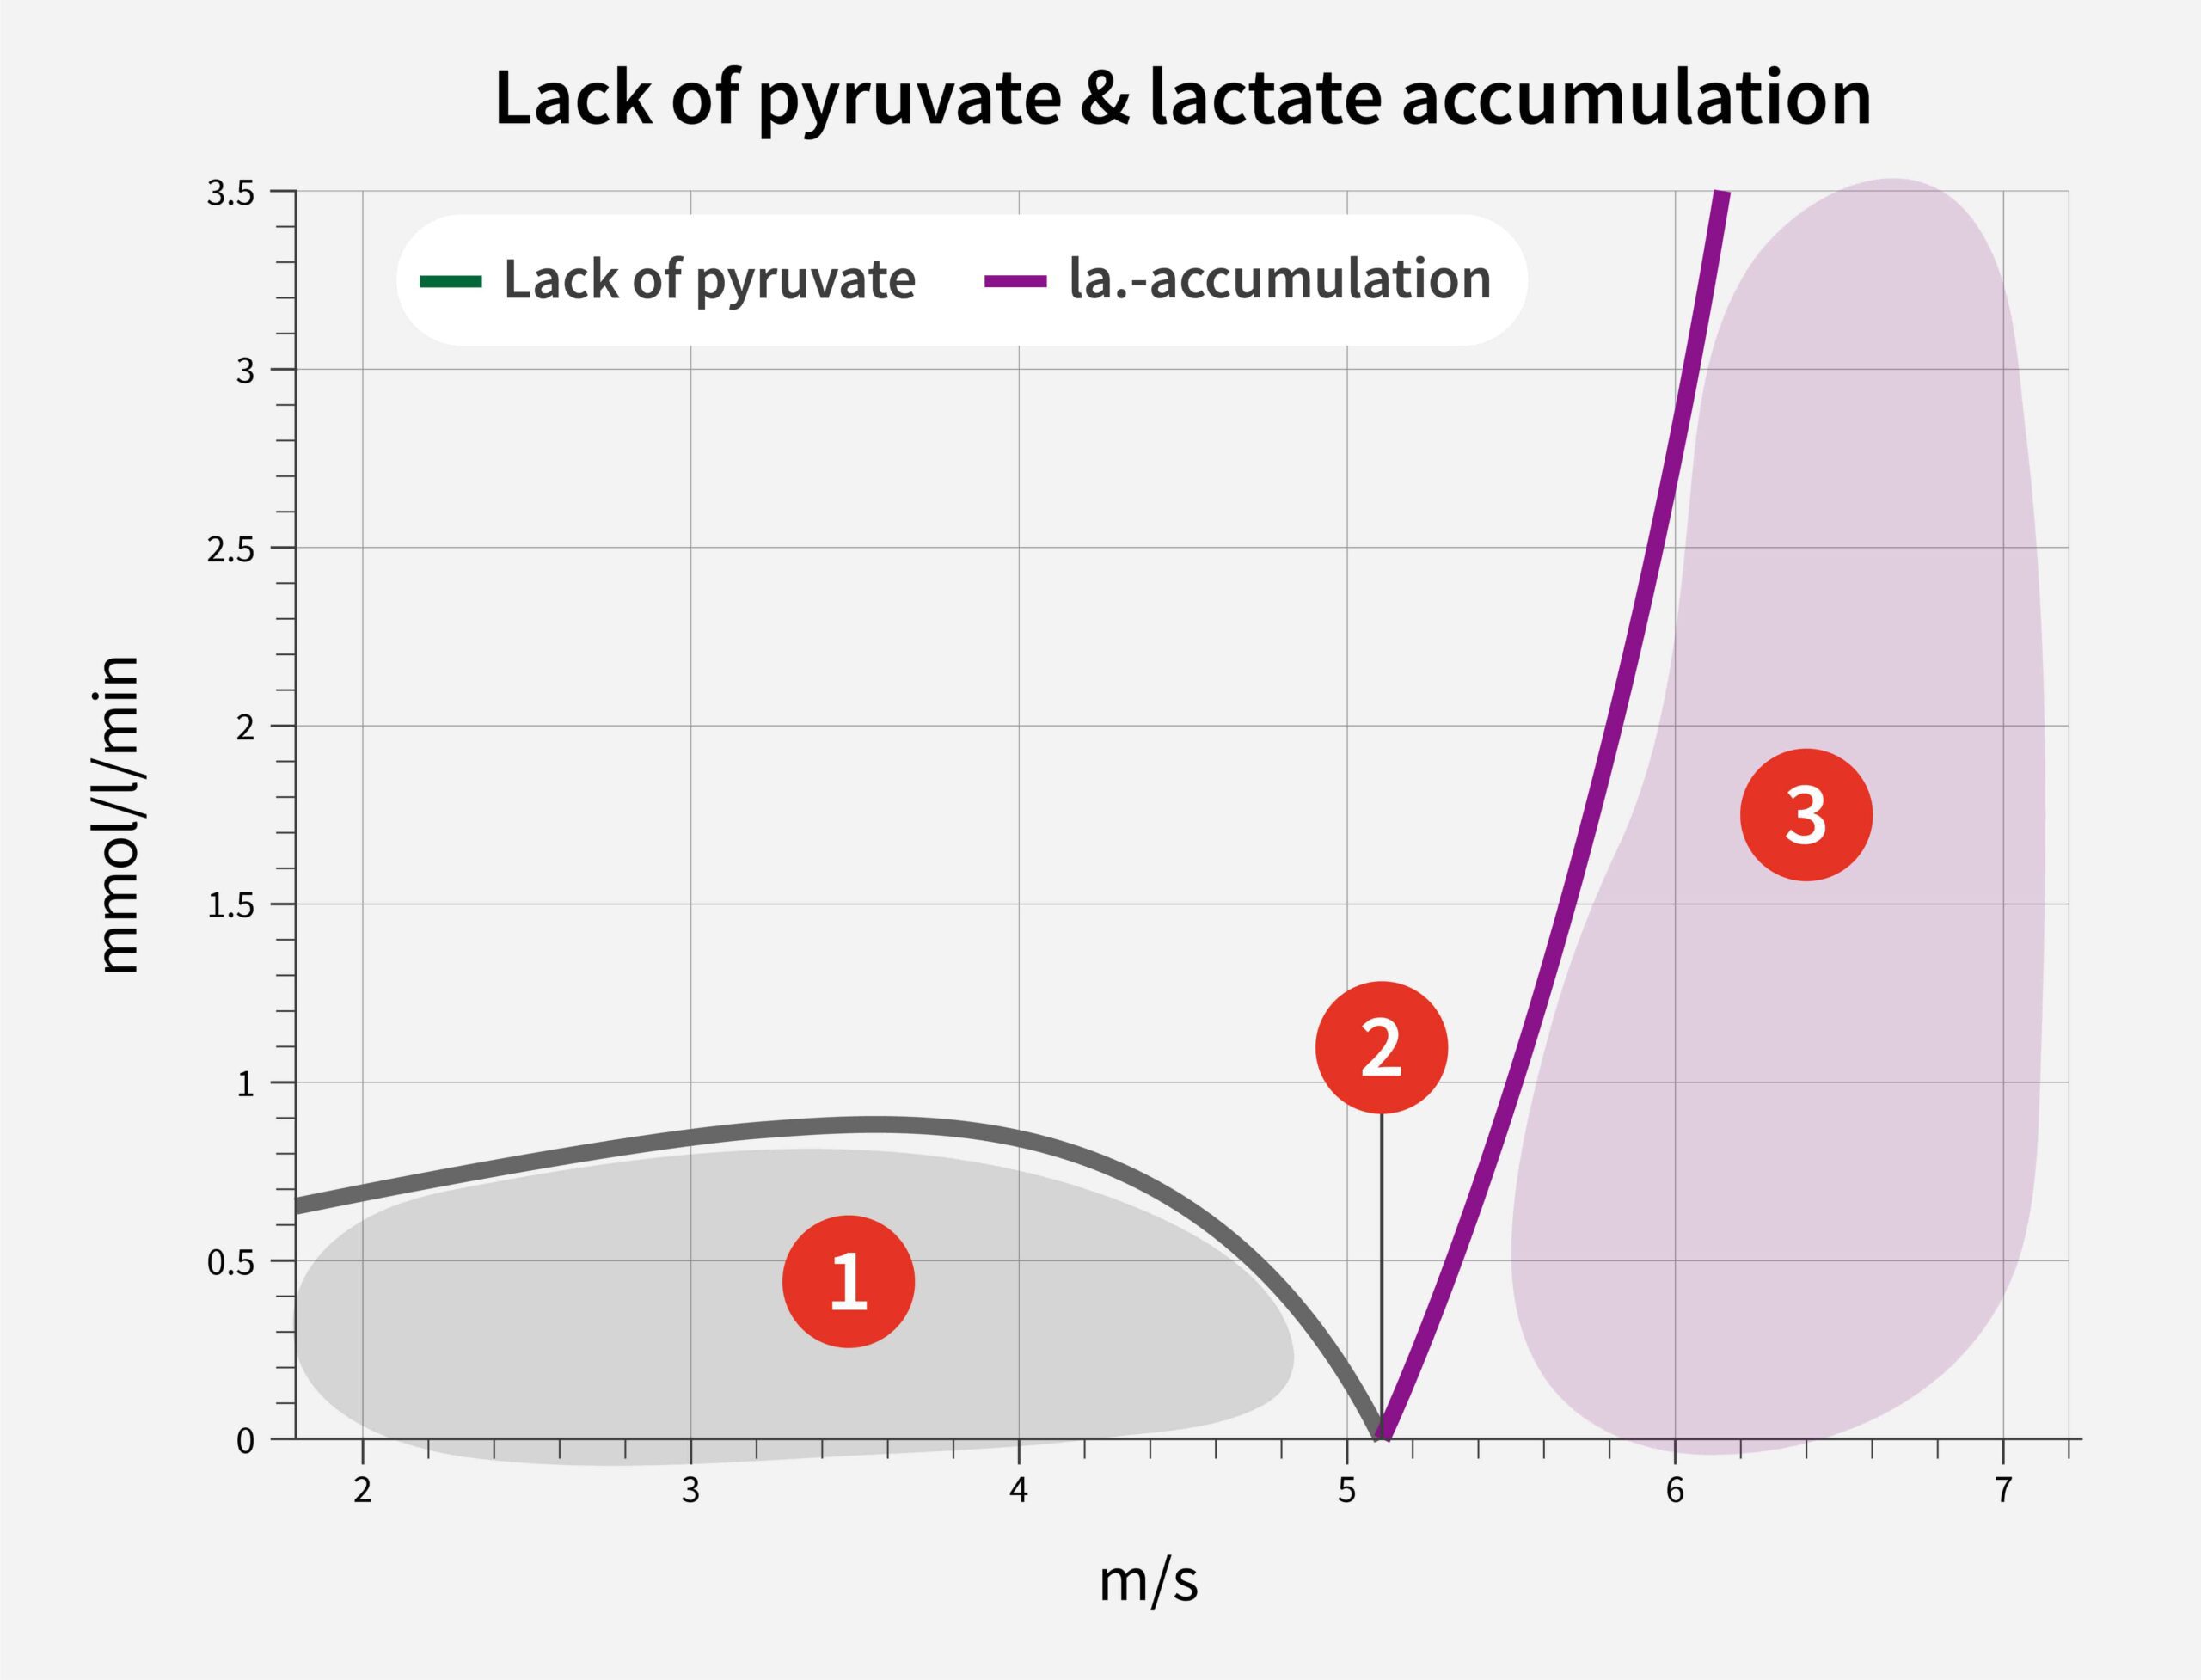
The lactate accumulation and recovery graph shows how fast your athlete accumulates lactate above anaerobic threshold (purple – 3) and how fast they recover from a lactate accumulation below anaerobic threshold (grey – 1).
This graph is a result of the individual VO2max and VLamax (among others) of an athlete.
In this example graph, the anaerobic threshold (2) is slightly above 5 m/s. At 6 m/s the lactate accumulation rate is about 2.5 mmol/l/min.
When your athlete’s maximal lactate concentration (measured during INSCYD test) is 12.5 mmol/l, he or she can run 5 minutes at 6 m/s (5 minutes * 2.5 mmol/l per minute = 12.5 mmol/l). The distance covered equals 1800m (5 minutes * 6 m/s).
You can also reverse the calculation to predict race performance. Say this athlete participates in a 5000m race. You know the maximal lactate concentration cannot exceed 12.5 mmol/l in this specific athlete. If the athlete would run 5.4 m/s, it would take about 15 minutes and 25 seconds to cover a 5k race. At this speed, the lactate accumulation rate is 0.7 mmol/l/min.
As a result, the lactate accumulation would end up being 10.8 mmol/l (15.4 minutes * 0.7 mmol/l/min). Keeping in mind that there is also a resting lactate value, this would be a realistic pace for a 5000m race, since the lactate concentration at the end of the race is below the maximal lactate concentration of this example athlete.
Say my athlete wants to run an 800m within 2 minutes. That requires a speed of 6.7 m/s. I simply look at the individual lactate accumulation rate at 6.7 m/s. When I multiply that accumulation rate with 2 minutes, I know what their lactate concentration would theoretically be at the end of the 800m race. When it’s below their actual maximal lactate concentration (measured in the INSCYD test) I know they can do it. When it’s above max lactate concentration, I know we first need to train before we can reach the desired results.
“It works: we're winning races, from a 100m through the 2 mile and the 5000m.”
Here’s how I know what we need to focus on in training.
Performance Projection
Here’s an example of one of my athletes who set a State Record in Iowa at the 800 meter distance.
First, she was able to run an 800m in 2:09. Five weeks before the record-breaking national championship race she came to my lab and did an INSCYD test. We then used the INSCYD Performance Projection feature. This tool enables you to change some variables like VO2max, VLamax, body composition, etc., and show how that would affect the race results.
Predict Future Performances With The Performance Projection
With an INSCYD performance projection, you can show your athletes exactly how much their anaerobic threshold (or any other parameter) changes when they increase their VO2max (or any other parameter) by say 5%. In our experience, that is exactly what motivates athletes to stick to a training program and retest more frequently.
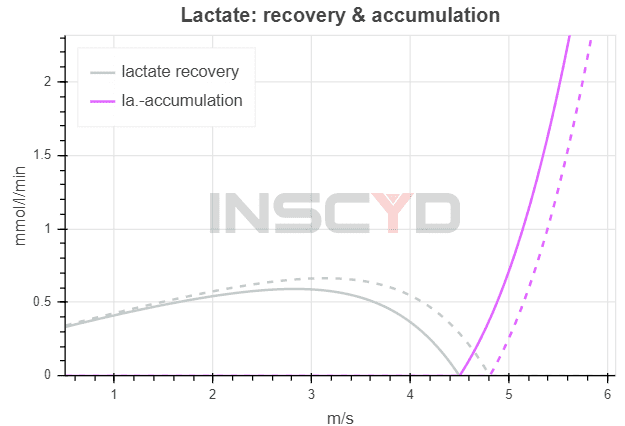
Here’s an example of how the lactate accumulation and recovery of an athlete would change (dashed line) if you increase VO2max by 5% and decrease VLamax by 5%:
Performance projection: before (solid) and after (dashed) an increase in VO2max (5%) and decrease in VLamax (5%).
With this new information you can recalculate race time, and see if the adaptations would be enough to get the desired race result.
Once we knew what metrics (e.g., VLamax) needed to improve, we started focusing on exactly that in training. Five weeks later she broke the state record by half a second with a time of 2:06.5 for 800 meters and won the national title for high school girls.
Written by
Benjamin Tilus
Elite Performance Coach
Elite performance coach and data analyst who has helped runners of all distances achieve maximum results through individual testing and optimised training since 2008. National and State Champion coach known for science-backed methodology.