From Power to Physiology: the mechanics of the Power-Performance Decoder
Power output recorded in training and racing isn't separated from the physiology of the athlete. In fact, the power output one sees on his powermeter are actually created by the physiology of the athlete.

Power output recorded in training and racing isn’t separated from the physiology of the athlete. In fact, the power output one sees on his powermeter are actually created by the physiology of the athlete.
INSCYD’s Power-Performance Decoder (PPD) is the first tool ever to combine field- and lab data, it enables coaches to see, how they belong together and how they are to be looked at as a unit.
In this webinar you will learn how to operate the PPD and the basic mechanism and science that is used to create a full 360° physiological athletic profile.
Agenda
– The basic principles of using power as the main data source
– How to merge lactate and VO2 data with power only data
– How to use data from training and 3rd party software with PPD
– Accuracy and typical errors using the PPD
– Cross – Validation of your data – ensuring the data is sound
The Presenter
Sebastian Weber, coach of 4x time World Time Trial Champion Tony Martin has worked with best athletes and Teams in the sport for more then a decade, including: Peter Sagan, André Greipel, Andrew Talansky, Cannondale, Katusha, Lotto, HTC-Highroad.
Sebastian is a consultant to several organizations, includung the french national swimming federation, cycling ireland, Team JUMBO-VISMA, german swimming & speed skating federation, and numerous private coaching business in europe and the US. He has his roots in coaching amateur and recreational athletes and founded the STAPS coaching & testing business in 2006.
0:00 Welcome again now, everybody. Thanks for the little waiting here. Thanks for your patience about this webinar, about the power performance decoder and the physiology and the mechanics behind that. As said, we have a quite heterogeneous group, and therefore we're going to have, you know, slides and information, some basic information, and some of you have already seen the technology or worked with the technology. You know, be patient with me. I think we are going to get there where you can get some nice additional insights. Okay, so the agenda.
0:40 First touching really base on what is the power performance decoder, and then going to, okay, why should you even care? Why, you know, why using the power performance decoder, and maybe why not using it. Then talking about the three pillars of the power performance decoder, so that's getting a little bit more technical. Then we're going to talk about what we measure and how we measure the data that goes into the PPD. And then we're going to talk a little bit about the hygiene of data collection, how to collect the data in order to ensure that the results that you're looking for
1:20 are actually accurate and fine. Then we are going to talk about cross-validation. That is something unique, and I'm personally very excited about to have this in the power performance decoder. There's a cross-validation to validate your data. And finally, we're going to look at the results that, you know, you can get out of the PPD for yourself, for your athletes, and take a short tour into that, you know, how these metrics of the results interact and how we create those. And, of course, you're also going to look a little bit on the accuracy
1:59 and validation and so on. Okay. So what is the power performance decoder? A little bit marketing wording here maybe saying, you know, it's really the only and world's only first calculation engine that is able to take in physiological data from, for example, lab testing or field testing, and also combining this data or running entirely only on power values, mean max power duration data from just the power meter, from indoors or outdoors, and really bridging or linking those two worlds, the pure mechanical power output with the physiological data.
2:46 So what goes in there? You know, as you might have expected, from us with insight, obviously you can put in lactate data just as you would do doing, you know, lactate testing this inside or without, without insight. So lactate data that you've measured in the field on the lab. What also can go in there is, for example, VO2 data. So if you have a lab or you have been tested in the lab and you do have oxygen uptake data from a REM test or something similar, you can use this and you can basically put this in, right?
3:25 And then the next thing, what you can do, you can, you can use it only with maximum power output, as I just mentioned. So you can additionally in combination or only use it with power outputs. And the last thing, you can also partly use, use it in combination with third party software, whatever, maybe, maybe have your own Excel sheets, where you look at some powderation stuff. You maybe use golden cheater or WKO, or I don't know, today's plan or whatever. And then there, then there is a way how you can utilize this data as part of your data set
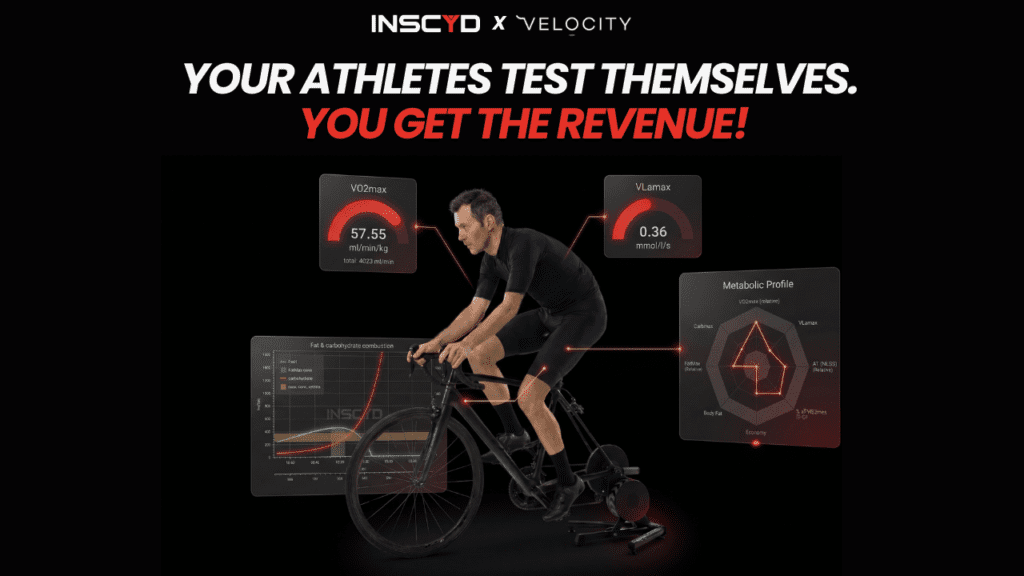
4:09 in the, in the PVD, in the power performance decoder. And what you get out of that is a complete metabolic physiological profile of your athlete, which includes VO2 max, so maximum aerobic performance or power, whatever worrying you're most happy with here. VLA max, so your glycolytic power, your glycolytic performance of your athlete, obviously the anaerobic threshold. Then you get out of it, the fat max, so maximum fat combustion rate and the power output at which that happens. And carb max, which is basically a term we use to describe what we have a benchmark for
4:45 carbohydrate sparing, which is a power output as 90 grams of carbohydrate utilization power. And then on top of that, you get a complete load versus recovery management. So you can look at the ability of the athlete to recover versus, for example, power output of it or lactate accumulation. We're going to look at aerobic and anaerobic energy contribution or distribution. And as indicated, obviously, you not only get the fat max as a carb max, but you're able to get the full, you know, fat and carbohydrate combustion curves as a function of power output.
5:23 And why you should be doing this, you know, why should you as a coach or why should an athlete care about, you know, using the power performance decoder? And my example here, my metaphor here is let's imagine you have a serious health issue and, you know, you're seeking for help. You need somebody to help you with that and fix it. The question is, if you have a problem and you need help to get it fixed, who would you go to? You know, who do you consult with this?
6:03 And, you know, do you go to just one doctor or some healer that is whatever, touching your belly or chest or something and trying to feel something? Or would you go to an actual physician who is, you know, able to do all the blood work or some screening, some MRI or, you know, whatsoever. And I think the answer is, is pretty clear, right? If you want to know what's going on, and even if you embrace a scientific approach only a little bit, then you would want to consult and work with somebody who has the tools and
6:40 has the technology, as we say in sports, to look under the hood and find out what's going on in your body and then prescribe a proper treatment. And that's more or less exactly, or how it should be at least, exactly in, in, in professional sports training for increasing performance. Before you prescribe a training, a training schedule, a training plan, you should better know what's going on in the body in order to prescribe, you know, the right treatment in terms of the right training. And from an athlete's point of view,
7:21 that is nothing that is related or that's only important for professional sports. The way how I would like to look at this is that recreational amateur athletes, they, you know, spend a decent amount of their time working to make a living, let's say 40 hours per week or something. So somebody pays them to do a work. And they still, most people are getting paid for the hours that you, that they put in something. So they make whatever, 30 bucks, 25 bucks, 50 bucks an hour whatsoever. Right.
7:55 And,
7:58 you know, so there is what I'm trying to say here. There is something like, like a price label on the hour of work. And so now these guys are trying very hard. Your athletes are trying very hard to, you know, to, to, to find another eight, 10, 12 hours of time to, you know, to invest into the sports. And that's precious time. If you would do the math here and somebody earns whatever, 40 bucks, that it's 400, 400 bucks a week. So that's more than 1600 bucks a month in average.
8:32 Right. So that's precious time. And there's nothing people should give away. You know, they should, they should be as precise with their training as possible. And now when we look at some, at some, some, some races or some scenarios, what people are training for, you know, most cases you as a coach or you as an athlete, you will have some kind of good idea what you are aiming for. Right. Some specific kind of race, increased fitness level whatsoever. Right. When you ask somebody, most cases they will be able to answer that question and say,
9:08 okay, you know, I'm training for 70.3. I'm training for Ironman. I've trained to whatever step up a level in, in cycling races whatsoever. Right. So that might be, for example, the cycling race, right. Or another example here that maybe might be doing an Ironman or qualifying for Hawaii or whatsoever. Okay. So let's look at the values that look at the metrics from a physiological point of view, which are important, which are relevant to those events. And for example, in a cycling race, what people know, what is important,
9:44 for example, is the ability to recover during the race. Right. So the race is almost never constant power output. You have accelerations, you have corners, you have attacks, so on and so forth. You need to recover. Every cyclist knows that. Right. That's something that is important. Then the race decisive moments include a decent, a significant amount of anaerobic energy contribution. So your anaerobic system is, is important. You're also going to max out your aerobic system. So the higher the aerobic energy power, the better. And then of course,
10:16 because the race is normally longer than an hour, you want to spare carbohydrates. So just some factors, which are important. Ironman or triathlon or, you know, these things very similar. What is important for you, for example, could be, or the answer that you would get when you ask your, your questions is, you know, sparing carbohydrates and look for a high fat, fat combustion rate. Right. So this is what, you know, what is important. And then ask yourself, what metric are you using in training? And in 95,
10:56 99% of the cases, this is still only looking at your threshold power in some way. And in some cases, maybe looking at W prime FIC or something like that in conjunction. But as you can see, this is, there's quite a gap, right? There's quite a disconnect. UFTP doesn't tell you anything about your anaerobic power. Your W prime FIC doesn't tell you anything about your anaerobic power. None of these, you know, are linked to carbohydrates and fat combustion. So it's, it's kind of ironic that, you know, we know what is important in the race.
11:32 And what we use for training is something that actually is not really related to these kinds of physiological metrics that we know that matter in the race. So this is, you know, pointing to the direction why you maybe want to do something different. So let's talk about the three pillars, what make, which creates a power performance decoder. We have the VO2max or the maximum aerobic performance power. It's one pillar of the PBD. The next thing that is needed in the PBD that is, pillar of it, is a VLMX,
12:10 the maximum glycolytic performance or power output. And then the third one is a measurement for the anaerobic threshold, right? These, these, these three metrics are essential for, for the PPD. Okay.
12:29 And now it comes to the questions, how do we measure that? And what we, you know, what we measure here, creating a set of data. So I'm going to talk about, okay, how do we get a VO2max? And how do we get a VLMX? And how do we get an FTP? And especially with the FTP, you're going to see, it's going to be, you know, it's going to be a little bit funny. Maybe. I come up with another metaphor. And let's say, we don't talk about FTP or VO2max.
12:58 Let's say we talk about the seat height. And I bring up this metaphor. I'm not sure if he's here today. I had this pretty much 15 years ago, 14 years ago with Joe Spindler, who was a professional long distance triathlete back in the days. And now it's a very, very successful, successful coach. And his first email he sent to me back in the days when I was still working at the university was about performance testing in the lab and different thresholds, right? Whatever, different lactate threshold, VT1,
13:26 VT2. I don't remember data. part of my answer to him was, well, look, the issue here is when we talk about these things like threshold, for example, is that there's so many different ways to measure that. And think about, you would measure the seat height of your bike, right? How would you do that? But one common way is, for example, to measure from the top of your saddle to the middle of the bottom back of the spindle. And there you already run into the first problem, maybe because it depends,
13:56 obviously, if you measure more to the front of the saddle, towards the nose of the saddle, or more on the back, right? If we change the distance, but that's one way to measure it, right? Back in the days at, you know, HTC Hyrule Columbia whatsoever, where I've been part of the team, V also measured from the middle of the bottom back of the spindle to the seat rails. Having the advantage, if you, for example, always measure at the back end of the, of the seat clamp, then you always have the same position as long as you fix it to the saddle,
14:28 right? And your seat height does not change when your saddle gets softened, you know, so that's another way to measure that. And then you could ask the question, but why don't we measure, for example, from the top of the seat to the pedal R? Because when we measure to the pedal, then we also include into this measurement, the length of the cranks. Okay. So not getting too much carried away here. Why are bringing this up? Because the point is the seat height here in this picture did not change.
14:56 There's just three different ways to measure that. And this relates to the power performance. Because as you have seen, there's so many different ways on how you can bring in data, right? From lactate, from VO2, from power, and that might be different sources as well. And what we need to make sure, and we need to be very transparent about and discuss or communicate about is, how is the data retrieved, right? How is the data obtained? Are we talking about the same thing here? Okay. So, as I said,
15:31 three different ways, three different results, same seat height. Very similar here with the PPD, for example, when it comes to FTP or whatsoever, right? And this is, again, something which is pretty unique in the world of coaching, or especially cycling coaching, right? Come up with a doctor or physician example. Let's imagine this would happen when you go to the doctor. Like, you know, when you go to a coach, I'm trying to go here, is when you go to a coach and you say, you know, my FTP is 300 Watts or my VO2 max is X,
16:08 Y, that, then you would come up to the question like, okay, how was that measured? You know, which software package, what kind of models, so on and so forth. Right. And this is something unique in our environment with training and coaching, especially in endurance sports, or has become an issue, right? Imagine you would go to the doctor and you say, well, you know, I'm sick. I'm, you know, I had more than 39 degrees of fever. And the arms of the doctor would be a question saying, okay,
16:36 how did you measure that? Now it sounds silly. It's just, it's just not happening. Right. Everybody agrees that 39 degrees or 39 degrees, and it is defined as fever period. And we should, I think, come to the point, you know, in, in, in coaching and training where we can agree on these things and make sure the measurements are fine and sound and cohesive. So what does this mean for the power performance decoder on how to enter the data and how to compose the data set? That's what I'm going to show you.
17:10 The flexibility on how to create, how to cook, so to speak. It's like, I always say, it's like going to the restaurant and you have to pick three courses, how to, how to create your menu, so to speak, with a PPD. So measuring view to max, you can use that. So in order to get to, you know, to cover your pillar for view to max, the first pillar, you can, for example, use measured view to from a REM test. Let's say you own a lab and you have a view to analyzer and you have people
17:40 coming in and, you know, you have a view to max value. You can use this as a PPD. Or instead, if you don't have that scenario, you can just use one single effort, one single all out effort and measure lactate before and after. Or if you don't even have lactate, so to speak, or, you know, you cannot get face time with your athlete, right? You're in different places. Then you can just have your athlete do one single maximum effort, you know, power only. Okay. What's about the second pillar?
18:12 VLMX. There's a protocol developed 2002, 2003, which was validated. I'm going to show you some data about this in a few minutes. So if you have this protocol, if you do tests in the lab for your VLMX, you can enter this into the power performance decoder, or you can just do a sprint effort outside whatsoever using lactate measurements before and after to get your VLMX, or which is actually a very, very accurate way is to just do the sprint, even without measuring lactate. It's highly accurate. It's really great.
18:50 So again, same scenario. Maybe don't have face time with your athlete, remote testing, so to speak. And then for anaerobic threshold, same thing. You can just enter it. Here we go back to, for example, third party software, right? You have some kind of model FTP or whatsoever. Just put it in, right? That's something you can do. What you can also do, even though it's personally not my preferred way, because of the issue with the W prime values and how those are calculated, referring back to the webinar we had two weeks ago.
19:22 You can also just do one single out effort, which, for example, could be the single out effort you already use for your VLMX, by the way, and just add a W prime value. Or you could create a power duration relationship. This is the power performance decoder. So you could add, for example, a five minute, six minute effort and a 10, 15 minute effort. And, and thereby have, you know, on power duration curve in there, so to speak. Right? Okay. So this is how you could create a data set here.
19:56 And I want to give you some examples. So for example, let's say one way to use it, as I said, you maybe have, you know, your mobile VO2 analyzer. You want to use, you measure the VO2. You have your guy doing a sprint effort with lactate, and then maybe some power duration relationship. Could be a lab scenario, for example, as well. Right? Somebody comes in, you put the mask on. It's always great. Also, you know, high perceived value, doing it, doing it with a, with a measurement.
20:26 So that could be one combination. Just as an example. Another combination just would be, you know, doing one measurement with lactate, for example, could be outdoors. Imagine you're in a training camp. You have your guys doing one single effort, approximately three, four minutes, measure lactate afterwards. On the same day, on another day, have them doing just a sprint by themselves, for example, and then just enter, for example, a model FTP that you get from Golden Cheater or WK or something. So in this case, as you can see,
20:58 you are testing time. Let's say, the VO2max effort is three minutes, and the typical sprint effort for the VO2max is 20 seconds. So in this case, your net testing time is three minutes and 20 seconds. You know, just think about it this way. That's really, really short. Right? So, long story short, you have a vastly reduced overhead, in terms of labor and disposables, when you do lab testing or field testing. And then, at least currently, one of the most popular ways to use it is to use only power efforts,
21:34 to do it only remotely. Right? Especially now, you know, during times of lockdown and people not, you know, going to training camps or not going to races or not going, not able to go to the lab. you know, using it with power only data has become, has become, you know, very, very popular, so to speak, in the, in the last weeks with that. And here's how, here's how this looks in the software. So you can see these buttons up there, circled with the red box. You know,
22:06 there's all different, all different buttons for mean max power durationship, for sprint effort, lactate effort. So it's, again, it's like a menu. You just click on what data you have and, and, and run this data. This is how it's set up. Okay. Talking about the data hygiene, because obviously, has said here, good data in, good data out. Bad data in, bad data out. That's, you know, you can't help that. That's the same with whatever, every model, every technology, every lab measurement you're doing. Right? And, again, I want to refer back
22:44 to the webinar we had two weeks ago about critical power and W prime, just showing you a few examples here. For example, these are some studies comparing uphill riding, seated riding in the flat, riding out of the saddle. So basically, when we are, when we are doing the testing or when we prescribe how to do the test, when we train people and teach people how to use the power performance recorder, we make it very clear that you need to test in similar scenarios as you want to use
23:20 the data for. So when you want to use the data for mostly training outdoors, for example, you should have your athlete test outdoors. Right? If you want to have your athlete using the data and training mostly in the flat, you should, you know, also test in the flat. Similar things with power meters, right? Don't mix the different power meters within one data set. You could do that if you want, but, you know, it adds potential error. Right? And then another thing is, as I said, riding indoors,
23:53 outdoors, for example, you can easily expect a two percentage of deviation in the data. And that is something please keep in mind because we will use that at the very end of this webinar. We will come back to the indoor versus outdoor, you know, relationship here in terms of power output. And when you have good data, I know that many people are interested in that. So this is our internal validation we do have for the PPD. This is showing you, for example, the comparison between the calculated
24:25 VO2max from using only power data versus the conventional lab setting, you know, to get to a VO2max. Very, you know, very, very close matching or obviously very, very small error or deviation that you can expect from using the PPD with, again, just one single effort with lactate. When you don't have the lactate, it still looks very good even though it is, you know, you have a little bit more noise in there, right? So the average deviation in VO2max that you're going to see is approximately 1.5 to 1.8 milliliters.
25:09 That is, technically speaking, about the maximum that you can see between the calculated VO2max in the PPD from using only power data versus what you would see in the lab and can discuss more how and why and so on and so forth. Then, coming back to the VLAmax, so one thing, you know, we have to acknowledge or people should acknowledge is that, in general, the repeatability and the reliability and validity of VLAmax, like the noises in this and generally a little bit bigger than it is in VO2max,
25:49 for example. you can always expect a noise within to, you know, being within 0.05 milliliters, millimoles per liter per second. So, what you see here is comparing power-only PPD versus the original lab protocol, you know, VLAmax calculation. And then, on top of that, my apologies, it is in German, but, you know, I think it's still okay to somehow read it. This is then correlating or validating the VLAmax, so to speak, measured in vivo to the activity of a key glycolytic enzyme, phosphophotokinase, in the muscle. So, we use muscle biopsies
26:38 here to compare that. Okay. So, again, VLAmax, highly correlated, obviously as it should be to the glycolytic performance in the muscle itself. And if you may ask, okay, why is that not even better? Well, because, mostly because if you just take 200 milligrams or 150 milligrams of muscle mass out of one piece of the leg, it's not really representative for the whole leg. And this is, by the way, also why we don't give slow twitch fastest fiber distribution. we do have this data, just one biopsy is not
27:16 statistically representative. Okay. So, it shows that it behaves in the same way.
27:26 Next topic here is how do we ensure that the data is sound? How do we ensure that the data makes sense? And what I'm going to show you here now is a typical lab testing scenario, and it's actually adapted from a real case. And we have several of those cases. We have seen several of those cases in the past. Okay. So, when you go to a lab, no matter how good the lab is, let's say you do a conventional lactate profile testing like you see here. This
27:56 ad lead, 80 kilograms, threshold approximately 350 watts, ends the incremental test, maybe not entirely exhausted, but close to maximum at 400 watts. This is, you know, Ironman triad lead. High level, obviously, good threshold, more on the heavier side. Okay. Threshold being approximate is a ballpark of 350 watts here. And what you maybe attempted to say is, you know, very low lactate concentration at the end. So, most likely also being Ironman triad lead, not the highest anaerobic ! guy, right? Not the highest VLMX guy. Okay. So, long story
28:38 short, this data was sent to us by somebody or actually somebody tried to enter it into the inside software using the lactate testing feature. And then additionally to that, you know, there was a VO2max measurement. And the VO2max of the athlete was measured at 85 milliliters per kg.
28:59 And now, from looking at it, without any offense, like from just looking at this data, who is actually able to check the data and check if it's sound, check if it makes sense, if this data combined, you know, are sound and make sense. And that's a problem because if you do some easy calculations here, you will see that, well, a VO2max of 85 80 kg equals approximately 540 watts. And even if you want to go down the discussions of different efficiencies or something, you know, then it's
29:37 still 520 or whatsoever. Right? But at the end of the incremental test, he reaches only 380 or 390 watts. And his anaerobic threshold is at 65% of his VO2 max then, measured VO2 during the test. So you should ask yourself, if I have a guy who's low in glycolytic power, glycolytic performance, low VLMAX, you might be aware that these are the people who have a high percentage utilization of their VO2 max at threshold. Right? So their threshold is at 85, 90% of the VO2 max. So doing
30:14 the math here, you know, it doesn't add up. It's, you know, his threshold would be at 65% of his VO2 max. So that's basically impossible. So one or the other, or at least one metric here, one data point is not correct in this data, in this testing. And this is nothing uncommon. You know, of course, this is an extreme example, but what I'm trying to go here is when you go to a lab, and I just had it recently with German Triathlon magazine, where they return the
30:48 test data of a lab testing, testing. And even during the lab testing situations, there was a discussion, oh, it's a VO2, maybe two milliliters too high today, two milliliters too low. And those of you who work with metabolic hearts know that working with traditional metabolic hearts can be difficult sometimes because, you know, they are a little bit off sometimes and you don't know exactly why and so on. So this is, you know, something common to happen, so to speak. So obviously it's a problem. Now, in the
31:19 PPD, that's unlikely to happen. And this is something, again, what I said initially, what I'm personally very happy about and what personally for me is, you know, very important to have this kind of cross-validation in there. So when you upload data into the PPD, and again, doesn't matter if this is a VO2 max measured in a test or it's power only removed on a SWIFT protocol, whatever your data source is, what's going to happen is, the algorithms are going to put your three pillars, your anaerobic threshold,
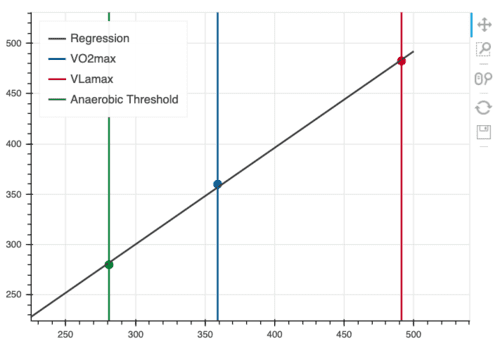
31:54 your VO2 max and your VO2 max in one chart. They are normalizing it, so to speak, backwards calculating it all to a power output so the data becomes comparable. So it's not VO2 max in milliliters, VO2 max in millimoles and threshold in power. It all comes back, it all comes back to bring it to find common ground in terms of the metric. And then we can compare it and we can see how good this data fits together. So in this case, what you see here, the black
32:30 line is a line of identity, so Y equals X, so the Y position of a dot is, so to speak, the measured value, the measured VO2 max, the measured VO2 max that you entered, and the X coordination is, so to speak, the one that is calculated. So how you could envision that is most people here will be aware that you end up going to show you the graph, the validation that you can calculate, for example, your anaerobic threshold by using VO2 max and VO2 max very accurately.
33:05 So what is happening here is basically the algorithm calculates the anaerobic threshold based on your VO2 max and VO2 max and compares it to the values that you measured or entered or whatsoever. And then it does the same thing in reverse, right? It uses your threshold and VO2 max to calculate your VO2 max and compares it. I hope this makes sense. So it always uses two values to calculate the third one and then displays you how good this fits together. So if all points, if all dots
33:32 would be sitting on the line of identity, that means that calculated value equals measured value. That means there's no noise and no error in this data at all. Very unlikely, but the closer they are, the better. So if your data is not sound, you could see something like this, where the data points deviate much, much more from the line of identity, showing that, okay, something is not sound, is not really great in your data. So you at least have a chance to go back and find out.
34:02 And maybe you know, right? In many, many cases, you know, you maybe had the suspicion that your view to analyzer was off. You maybe, you know, used your, most, in most cases, used a threshold value from whatever training software looking at the last 30 days, so you know there's more noise in the data, or you have been there doing the lactate measurements, and you already had the feeling there was an outlier. So here's your chance to correct that. And another way to correct this, you can attach a
34:35 weight factor on each metric. So, for example, if you know that, you know, the sprint test for the VLMX wasn't really great, or you know it was great, and your, you know, three-minute effort with a lactate measurement was great, but maybe you wanted to reduce time, you only did 20 seconds and three minutes, like suggested, and just use your FTP from Golden Cheetah, WKO, and again, it's not because it's a bad product, it's basically because you're looking at a mix of data out of the settle, in the
35:05 settle, so on and so forth. There's more noise in the data, so maybe you expected your threshold not being, you know, as close. So that might be this picture here, right? Where the VLMX, the blue dot is close to the line, and the green one deviates a little bit. So what you can now do, you can use those weight factors and so you would say, okay, I know my VLMX is great because I was there, it was a great test. I know my VO2max testing was great
35:33 because I have been there, but I know my threshold is maybe not because again, I used, you know, I used the data source which was not happening on the test day or different power meter or whatsoever. And then you can apply a weight factor and now see the difference. Now I put a weight factor here of 10 VLMX and VO2max, and now what's happening, my VLMX value, and my VO2max value get closer to the line by sacrificing, so to speak, sacrificing the anaerobic threshold value. So you basically
36:05 came in and said, I know, you know, these are the most accurate values, climb more weight to it, and then, you know, work with that. So work more with the data I'm confident in, right? So long story short, there's two aspects to the cross-validation. One, it is your safety net. It is your safety net. You can exclude that there's a significant error in your measurement and you're not fetching it, like I showed in this lactate and in this lactate graph and the view to max, right? So it's
36:52 almost impossible, like you really would have to ignore this cross-validation to make this error, right? So it's your safety net. It's almost impossible to give out data, give out results, which are not double-checked and correct. And the other opportunity that it is for you is to, you know, use a wave factor on the metrics which you know are most robust. And if you think the robustness is all the same, then you just use the standard wave factors and what's now happening, you are distributing the relative error equally
37:35 over all three metrics, right? So you accept obviously as always, right? Even as lab testing, there's an error in your VO2 max, 2%. There's an error in your maximum lactate steady state, even if you would do 30-minute efforts, you know, gold standard. So you have to accept that there's an error in it. And when you use all the weight factors on one, you're distributing this weight, this error equally over all three metrics and make sure that you get the overall picture which is most correct and most
38:04 sound. Okay? So now talk about the results. So what do you get from it? What do you get from it? And I'm not going only to show you some fancy graphs here. I would really like to use another five minutes to walk you through those graphs and explain how those are connected. it. So one thing, you know, which is very popular is what we call the fingerprint. So that's like the strength and weakness profile. Data points more to the inside means low, doesn't mean good or bad,
38:36 means just low. So for example, body fat in this picture would be relatively low and VO2 max would be relatively high because the more the data point is to the outside, the higher it is. And this is ranked to a peer comparison group based on gender and performance level and so on and so forth. Okay. Just have more questions coming in. Please keep the questions. We are finished in a few minutes, five to ten minutes and then we can come back to the questions. Thank you.
39:05 Another way how to express things, what we call the metabolic capacities, that so to speak your results page with the most important results, VO2 max relative and total, VO2 max threshold and as indicated fat max. Again, the ranking here to help a little bit understanding the data better, how this relates, so what this means to my sports performance. And the key thing or key feature of the results is what we call the load characteristics. So load characteristics is showing you how different metabolic metrics behave under steady
39:46 state conditions. conditions. And there's the importance on steady state conditions. So mathematically speaking, time is infinite. And the other thing is this only relates to working muscle, right? Like all the measurements that go in, power output, right, is measured only on tissue that is involved in locomotion. So muscle that is producing the power that you measure at the crank or pedal or so on. the lactate if you measure lactate is, you know, 99% coming only from your working muscles, okay? So therefore what you see inside can
40:20 only and is only related to working tissue, okay? That's something that you have to keep in mind. Obviously if somebody, whatever, has a lot of upper body movement on the bike and therefore needs additionally 200 million liters of oxygen, we cannot fetch that. But because it's not used in locomotion, it's not producing any power, we don't care, okay? So let's dive into that real quick. What is load characteristics and how these metrics that you see in the results are interconnected? First thing here is metabolic demand versus
40:53 oxygen uptake. Metabolic demand, dark blue curve, is basically more or less only transforming the power output into an oxygen demand. So very simplified speaking, you can just look at a textbook and read, oh yeah, you get approximately 20.9 kilojoules per minute, minute for one liter of oxygen. And kilojoules per minute, you know, power is juice per second, so you can do the conversion here. Right? So long story short, dark blue curve here is your power output converted, basically just an oxygen uptake because now it's easier to
41:29 compare. And it is easier to compare to the actual oxygen uptake, VO2, which is a light blue one. So what I want to draw your attention to is basically at a low intensity, let's say for example here in 100 watts, you can see that the oxygen demand, or you could simplify saying energy demand, is almost matching your oxygen uptake. Well, no surprise, right? This is what you would expect. You would expect at such low intensity that most of the energy needed is covered aerobically. Now, when you look at
42:06 a higher power output, you can see this gap is opening up. And you can see it's marked here or visualized with this light blue area. So the light blue area, so to speak, is the gap of energy or gap of oxygen or whatsoever that is not covered by aerobic metabolism but covered by glycolytic metabolism. You could call it the glycolytic gap. And of course, the higher the power output, guess what? The higher, as expected, the anaerobic energy contribution is going to be. So here you have aerobic
42:36 versus anaerobic energy contribution, simplified speaking. And then we go to lactate production and lactate combustion. And let me start with the lactate combustion. And I always come back to my prime example here. Let's imagine you do some kind of interval training. You do a hard interval, four minutes, six times, almost to exhaustion. You accumulate a lot of lactate, you do a rest. What are you doing in the rest? Most likely, even without a coach, people will not just lay on the road or sit in the grass
43:10 for 10 minutes and wait. Because what would happen when you get up and do the next interval? How would your legs feel? Pretty heavy, pretty bad. And the reason for that is because you basically need to keep moving. And this is where I'm trying to go here. Everybody knows that. You need to keep moving in order to recover, to get rid of the lactate. And this is the simplified way if you want a more biochemistry of looking at it. The lactate, when you want to combust the lactate,
43:38 is pushed into the Krebs cycle. So the Krebs cycle, how much lactate it can take up, you know, depends on how quick, so to speak, simplified thing is running. So how much did you activate your aerobic system? That's the upper ceiling, right? You can also say if you want to burn something in this universe, then you need oxygen for it. So if your oxygen uptake is down, you cannot burn anything. And this is where this graph relates to. So look at the shape of your maximum aerobic
44:07 lactate combustion curve and your oxygen uptake. You can see the shape is very similar. And the lactate combustion is actually millimoles per minute. So, you know, these things are interconnected, obviously. So the blue curve, long story short, determines how much lactate you add could combust in steady state conditions as a function of power output. And then the red one, as you can see, is actually the lactate production. So what you might want to look at is this very, very popular state of intensity where one matches the other,
44:40 where the rate of lactate production equals the rate of possible lactate combustion. And you can zoom in here and you can see if you go left of that, that means that the possible lactate combustion is higher than the production. And right off that, the production exceeds the combustion, therefore the lactate would have to accumulate. And this is what people normally call the anaerobic threshold. And I promised you, I show you some validation. So this is the original validation for that. That's for males. I have another one for
45:13 females I didn't bring today. You know, average error in calculating maximum lactate steady state power output is approximately 2.23 or 2.5 or something percent, doesn't really matter. Another way to look at this graph, for example, is to look at sub-threshold conditions. So I picked one example here, 180 watts. And at this power output, in this athlete, the gross combustion, or the max, the possible combustion is 0.89 millimoles per minute. And the gross production, so to speak, is 0.37. So there's a gap, there's a delta, there's a
45:54 difference of 0.52 millimoles per minute. Okay? Of additional lactate that could be pushed into the metabolism. Going back to the example, you do a hard interval training, for example, or cycling race, you need to recover in the race. And this is then basically what we plot in this curve, and we call it the lack of pyruvate, it's maybe easier to call it the ability to recover. So this gray part of the curve shows how quickly your athlete can get rid of additional lactate that has been accumulated,
46:32 right? Let's say your lactate concentration is 8 or 10 or 9 millimoles or whatsoever, right? This curve shows you at which power output how quickly the athlete can recover. From a sporting perspective, the higher the better, right? Because it means you can recover faster. And then if the apex of this curve, the plateau would be shifted further to the right, would be also better because then it means you can recover faster, you can recover as fast, but at a higher power output. So that's what you want.
46:59 You want to recover faster and you want to recover at a high power output. Because obviously in the cycling race, I mean, in an interval training, it doesn't matter, but in a cycling race, you cannot just raise your hand and say, oh, you know, please go slow. I need to recover. That's not how it works.
47:16 So this is your recovery curve. The touchdown point, so to speak, is a point where you neither are able to clear additional lactate nor you're accumulating lactate. So your metabolism is saturated with pyruvate or lactate. And this is, again, what we call the anaerobic threshold or maximal lactate steady state or whatsoever. Don't really want to go into this discussion. And then on top of that or right from that, you can see how quickly somebody accumulates lactate. So if you want to use lactate as a marker, for example, for
47:53 fatigue, not saying that it causes fatigue, just it goes along with fatigue. You know, and you know how high the lactate concentration can get, then knowing how fast it accumulates is basically telling you how fast you are running into fatigue here. Right? Okay. And then next one, the final one, so to speak, not talking about the interval training, but more about whatever pacing and Ironman races or training intensity for long steady state is, you know, fat and carbohydrate combustion. So fat and carbohydrate combustion, again, only for the
48:37 working tissue as a function of the power output. And you can see we mark the fat max, so the zone of maximum fat combustion. We mark it green. And then the orange, the orange area there is, is marking 60 to 90 grams per hour of carbohydrate combustion. So I have to say that the right Y scale is only, is only for, um, the grams is only rated to the carbohydrate. It's obviously not the grams for the fat. So 60 to 90 grams is what is known, what is
49:09 approximately the maximum exogenous uptake rate of carbohydrates. And people are using this, um, people are using this to, you know, prescribe very, very, very, very accurate fueling strategies for, for races, uh, but also obviously training intensities, right? Well, what is my fat max zone? How much do I need to fuel during training? Um, when tomorrow's the rest day or when I'm in a training camp and have more other days, um, coming up, um, of training and therefore need to be a little bit more careful with my
49:39 carbohydrates. And this is what you get from it. And to finish this off, I've, you know, I'm lucky to bring a little anecdote, which just basically happens two days ago. And I got the confirmation that I'm, that I'm able to use this. Um, and this is, this is of a guy actually in Finland, not even know if he's here today, but I got permission to use his data. So we offer the power only base protocol for free download on our website. So what this guy did basically, he downloaded
50:14 the protocol and he carried out the testing by himself on three different days. So he distributed the efforts over, over three days, um, outside, as I said, right. And then he went into the, I hope to pronounce it right, the Kihu lab, which is basically, um, uh, you know, high, high, high performance sports center for Olympic sports in Finland. They work in all the Olympic sports and only in Olympic sports for high performance athlete. And this guy actually works there as a physiologist. And what we didn't know,
50:50 obviously, because, you know, again, the protocol is free to download. What we were not aware is that he went after the testing a few days later, he basically went into the lab and did, you know, chapeau, 30 minutes maximum lactate steady state testing, uh, which is a gold standard for coming to a maximum lactate steady state. He did a REM test to go to the VO2 max, um, and measure the VO2 max, and he did, uh, fat and carbohydrate testing. And I'm just going to show you real quick, uh,
51:19 what we have. So the PPD came up, this is threshold with 292 watts and the maximum lactate steady state deviated by, uh, 2.5% approximately, uh, by 8 watts at, uh, 284, right? I'm not going to split hairs here. If it's maybe, what have a 283 or 286 or something, uh, the VO2 max on the REM test was approximately 1.4 or 2.3% lower than it has been, um, you know, in the PPD analyzers. And again, you could argue here, yeah, 2% is a normal error. You have an Nvv2 VO2
51:54 analyzer and there's a few days in between, blah, blah, blah, blah, blah. Again, the important thing for us here or for me personally is that this is exactly within the ranges that we found within our own validations here, so to speak. Right. Um, and there's one other aspect to it. And I promise to come back to that slide. This is the PPD was done outdoors. It was the same power meters, but it was done outdoors. And the lab testing, obviously, what was, was done indoors. And if you remember that
52:25 study, you can expect an offset of approximately 3% indoor versus outdoor power output. So I'm not going into this. We did this. We tried this. We did a virtual performance profile. We changed, for example, the VO2 max by the 1.4 milliliters. And then we were able to replicate the maximum lactate steady state in the lab by, by the watt, exactly by one watt. But again, even, even without the difference, I think it was great to see. And again, it's an anecdote. We didn't know about that. And then the last thing really
53:00 here to share about this is then, you know, talking about what we calculate from this because you could say, yeah, fair enough, you know, you have a threshold estimate and that's good. That's, you know, a lucky punch or whatsoever. I get my FTP or something from Golden Cheetah or WKO or something as well. And I also get a VO2 max estimate, not really care. VO2 is more accurate. So what's about all these steady state characteristics? And I hope I made a little bit clear how those are
53:32 interconnected. For example, I didn't say, didn't mention that, but I mentioned it now that the carbohydrate combustion curve that we calculate is related to your lactate production curve because the only way how you can produce lactate is using glucose. Okay. So these are interconnected. And so what he did, as I said, he also tested for fat and carbohydrates. And this is what he basically did send me. That's a screenshot from his email, you know, basically sending his test results. And you can see that, yeah, on every power value in an
54:09 incremental test, the calculated fat and carbohydrate using a metabolic heart in this Olympic training center almost by the gram matched the predictions from the power performance decoder. So, yeah, obviously I want to finish with something nice. And that was my last slide for this webinar. Thanks for impatience. Got pretty long. Good that we have some endurance athletes on here. So now we are open for more questions. We are open for more questions. We are open for more questions. We are open for more We are open for more
54:45 We are open for more We are open for more We are open for more We are open for more We are open for more We are open for more We are open for more We are open for more We are open for more We are open for more We are open for more We are open for more questions. We are open for more questions. We are open for more questions. We are open for more questions. questions.