Colorado Performance Workshop
Three workshop sessions covering: the metabolic origin of the anaerobic threshold, athlete performance profiling beyond threshold, and practical application of physiological data in real-world coaching.


1) The metabolic origin of the anaerobic threshold. It is one of sports most used terms when it comes to endurance performance and the most important benchmark value. However, most people do not understand what it is and why it even exists.
2) Athlete performance profiling – beyond critical power testing. Critical power testing has become the most important tool for benchmarking cyclist performance in training and competition.
3) Glycolytic capacity – VLamax – the unnoticed game changer in endurance performance.
4) Nutrition strategies for endurance performance. Learn how to create evidence based but personalized nutrition strategies for each of your athlete – on the fly.
5) Boost your coaching business – lessons learned from growing Europe’s biggest coaching business. In 2006 the STAPS human performance lab and coaching business was founded. STAPS grew to Europe’s biggest and most successful coaching business, pushing most competitors out of the market.
The methods learned here apply for swimmers as well as for triathletes.
The Presenter
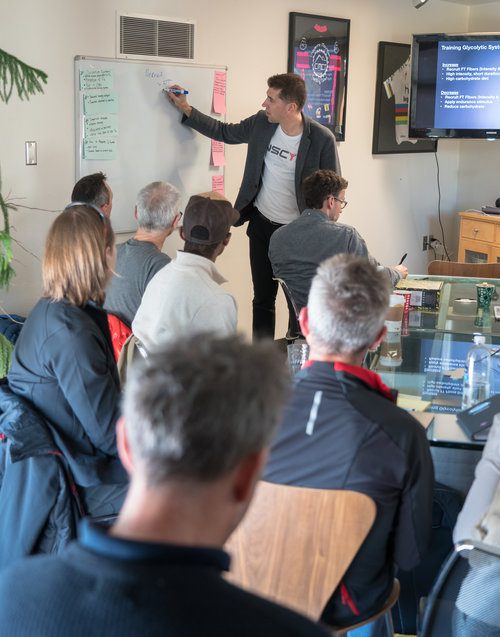
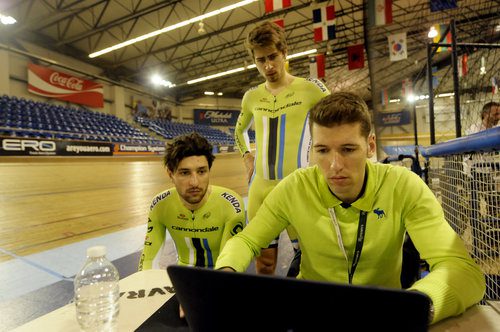
Sebastian Weber, coach of 4x time World Time Trial Champion Tony Martin has worked with best athletes and Teams in the sport for more then a decade, including: Peter Sagan, André Greipel, Andrew Talansky, Cannondale, Katusha, Lotto, HTC-Highroad.
Sebastian is a consultant to several organizations, includung the french national swimming federation, cycling ireland and numerous private coaching business in europe and the US. He has his roots in coaching amateur and recreational athletes and founded the STAPS coaching & testing business in 2006.
0:00 about some lessons learned from running a coaching business and running a lab so that's like the final remarks after the after the nutrition part again if there are questions raise your hand right if you're gonna take care of that something is not clear if you're you know it's not easy to hear John in the back just let me know okay so first a really brief overview about myself why I'm standing here and why I'm talking about you know some of the metabolic things and some of the business things so giving a little bit of my background so I'm I
0:37 studied sports science and molecular human biology and then started working as cycling coach original for also runners and triathletes for amateurs and recreationals so maybe in a scenario where you are most likely in back in 2001 2002 and then I went into professional cycling starting as a coach and one of the most successful virtual teams or this time proto teams have been lucky to be able to work with some of the best athletes out there and then parallel to that founded my own coaching business back back in Germany which I'm going to yeah tell some
1:22 experience and share some experiences what what worked for us and what didn't and basically in the last years getting more involved or some other sports in swimming canoeing triathlon again there's some federations and stuff okay so that's that's some of my of my background and quick overview again about today so I'm going to talk a little bit more focus a little bit more on metabolic origin of power and aerobic threshold and then from there we're going to dive into some ideas around training picture short and hard versus long and easy because this is kind of the recurring
2:05 question in coaches right they're going a lot talk about going to talk about a lot about like VLMX or glycolytic capacity which is kind of for most people kind of a new metric however it has been successfully used in different sports in the past decade or 15 years and then talk a little about individual training programs nutrition and some of the business part of that okay and this is really about hopefully presenting some new ideas to you and hopefully triggering a little bit sinking outside the box right and so I want to start with what I guess
2:48 most people are aware of this and this is what most cycling coaches do today is you know power duration curve right I mean truth be told no offense these days most of the coaching we are doing is based on this two dimensions power and duration right some of the background I've started using power meters I bought my first power meter 95 and this these days it was more or less only the SRM out there so I started using this for my own writing and then for my coaching so what people are normally do and
3:22 what I'm going to look at for example you pick any duration on this curve right and in my example here I'm picking four minutes could be 20 minutes could be one minute doesn't matter right so you're looking as a coach you're looking to improve that power output because that is whatever you think this is the decisive moment in the race are going to be four minute effort this is a Strava KOMU athlete is shooting forces is whatever the duration of the caramond and the tour of lunders for whatever reason just for the sake of
3:50 simplicity we choose this example okay so what we're going to talk about is basically where is this power coming from or how is how and how is it happening that you can measure four minutes for 75 watts and the first idea and we just talked a little bit about before one of our partners here GBM eyes who enables us to do it to offer this cleaning for you for free and I'm going to pull out one example what I mean with where does the power come from and hopefully getting you started thinking a little
4:24 outside the box is when you produce this power obviously a big part of that power as you know is the force you apply to the pedal right I mean power is basically the torque multiplied with the speed so the cadence so to speak right and if you think about yourself when you do a long bike ride and afterwards you go home and you walk up some stairs you will feel often that your legs hurt from walking up the stairs and why do they hurt because it's a very similar if not to say the same movement right it's knee extension
5:03 right which you're performing and because you did the same movement for three four or five hours before you feel your muscles and they may be hurt now when you walk up some stairs what you want is you perform the knee extension and you want to lift your body weight up to the next step when you're sitting on the bike when you're sitting on the bike you're doing the same movement and you're assuming the opposite is happening instead of your body weight going up the pedal is going down and the truth is both things are happening especially when you ride with a low RPM with a high torque when you do a knee extension part of that force is going up to the pedal to go the pedal down and part of it is unweighing yourself out of the saddle
5:48 right so think about it we're all thinking of power output we're all thinking of training our legs but if our abutment if our counter force so to speak on the bike is not good then you might lose something you may be concentrating too much on training the legs and why I picked this example because again I think it's a nice one to start thinking where the power is coming from and we did this about 10 years ago we started doing this at high road times some of you remember HTC high road team
6:22 we were doing that we were doing that we were looking at we were measuring the force actually in the downstroke and simultaneously in real time measuring the weight of the rider on the saddle so we could quantify how much force so to speak somebody loses while for example doing a seated effort okay just one example again I said maybe a different use of the technology some of you might already have right looking at so to speak the efficiency of the pedal stroke in terms of force okay now I have to admit I'm not very good at biomechanics the only thing I really know a little bit about is metabolic stuff so I need to switch back here from the biomechanic part to the metabolic part and I stay with that example of the 470
7:12 475 watts so again let's say for whatever reason this is the benchmark we're looking for okay and imagine you have an athlete comes to you you measure 475 watts and three months down the road or three months before that you measured for the same duration the same power output what does it mean does it mean nothing changed so that's the question here right and to to bring this a little bit to provide some more context to that think about it 10-15 years ago when let's imagine I'm an athlete I come to you I would like to have a training program from you and one of the first questions you may ask me is okay I need to know your current status
7:58 okay imagine I come to you and say today okay you know my my status is I can ride 30 minutes 25 miles per hour yeah you're already laughing right you say like that tells me nothing why why doesn't tell you that anything because you say well the speed he's riding is composed by so many different factors wind uphill so basically drag against power output right so now you dig one level deeper and say oh if you tell me your power output for 30 minutes I know everything
8:27 so to speak right so the point is what we are going to do now in the next minute is we are digging one level deeper and say okay where is this power coming from okay because I mean first grade you know how is power generated there's three ways for the muscle to produce energy breakdown of creating phosphate phosphate is glycolysis and aerobic metabolism so basically the power that you measure you can break this down to its origins and quantify basically yeah where the power comes from what's the origin of that power output and
9:06 when you measure in this example for the same and when you measure in this example for 475 watts and maybe in another occasion you measure the same that doesn't mean that nothing has changed it can be composed completely different because you did a training and maybe this training whatever led to an increased performance of the glycolytic system and therefore there's more power coming from that system now you can tell me okay I don't care right because it's still four minutes 475 this guy goes up the four minute climb at the same speed because it's still the same power output
9:36 well I care because if I'm able to know that similar extent to the same speed versus power if you're able to know how it's composed I can put my training program next to it and over the time maybe get an idea and say okay well this kind of training seem to increase the glycolytic part this kind of training seem to decrease the heroic part and therefore one day possibly pull things together and finally combine the best performances of my athlete to come up with a higher power output
10:08 right it would be similar to if you think about a marathon runner the body weight measures a lot and running economy and something like you to macro threshold it's like trying to come to the position where you can pull these things together right lowest body weight best running economy highest view to max and so on and so forth same thing right so when you understand the how the energy how the power is composed it tells you a lot about how your training worked okay and I'm going to use instead of the four minutes power effort I'm going to talk a little bit about anaerobic threshold or these days it's more called FTP which kind of means more or less the same thing so for the sake of simplicity I'm fine with either terminology here okay
11:00 okay and in general one definition you could use it's the highest intensity speed or power and athlete can sustain without accumulating lactate so in a more scientific way speaking it's a maximum steady state of lactate concentration right everybody kind of know that okay now I use as an example because obviously everybody uses it right I mean FTP training that's everywhere right all our training zones are based on FTP everything people are shooting shooting for and training is FTP or the forums and articles are full of FTP training so I use this as an example here okay and I want to explain a little bit what is it scientifically so that everybody is on the same page okay so first important to understand it it's a blurred line there is not that anaerobic threshold FTP of 300 watts and not 302 it's within the same
11:59 situation within the same minute because of the regulation of the same minute because of the regulation of the metabolism it's in a range of 5 to 7 watts okay so it's a little bit of a blurred line right and riding below this blurred line what's basically happening is per definition lactate levels were stabilized and therefore also stabilized and therefore also stabilized and therefore also pH levels stabilized and therefore also pH levels stabilize and therefore also pH levels stabilize and therefore also pH levels stabilize and therefore pH levels stabilize and therefore pH levels stabilize and therefore pH levels stabilize and therefore pH levels stabilize and therefore pH levels stabilize and therefore pH levels stabilize and therefore pH levels stabilize and therefore pH levels stabilize and therefore pH levels can be used as part of the fuel okay and above that per definition as we just said blood lactate levels will increase and therefore pH levels will increase and therefore pH levels may decrease and therefore pH levels may decrease and therefore pH levels may decrease and therefore pH levels may decrease and therefore pH levels may decrease and therefore pH levels may decrease and therefore pH levels may decrease and therefore pH levels may stabilize and therefore pH levels stabilize and therefore pH levels can be used as part of the pH levels of the pH levels can be used as part of the fuel okay and above that per definition as we just said
12:46 pH levels are the pH levels are the pH levels of the pH levels of the pH levels of the pH levels of the pH levels of the pH levels of the pH levels of the pH levels of the pH levels of the pH levels of the pH levels of the pH levels of the pH levels of the pH levels of the pH levels of the pH levels of the pH levels of the pH levels of the pH levels of the pH levels of the pH levels of the pH levels of the pH levels of the pH levels of the pH levels of the pH levels of the pH levels of the pH levels of the pH levels of the pH levels of the pH levels of the pH levels of the pH levels of the pH levels of the pH levels of the pH levels of the pH levels of the pH levels of the pH levels of the pH levels of the pH levels of the pH levels of the pH levels of the pH levels of the pH levels of the pH levels of the pH levels of the pH levels of the pH levels of the pH levels of the pH levels of the pH levels of the pH levels of the pH
13:16 So there's one reason why everybody is looking for that metric since decades in all kinds of endurance sports. Okay? So everybody's on the same page. It's important. Everybody wants to know about it. Now, my point here is what I would like to talk to you and start to have you think about is why does it even exist? No offense, but if you ask most of the coaches and you go, okay, do you know FTP? Do you know anaerobic threshold? Everybody has at least a basic understanding of what it is. Right?
13:46 And pretty sure everybody creates training programs to change it, to train it, to increase it. Now, why does it exist? What does it cost? You know what I'm trying to go here is that if you don't know how it is created, how can we possibly make informed decision how to change it? You know, I can go to you and say, well, you know what? I want to lose body weight. I want to lose body fat. And you have a basic understanding, I assume, about the mechanism that I need to burn more energy than I've taken, right?
14:22 And I can go to you and ask, what is you to max? And I might have an answer getting, okay, it's something to do with the mass of mitochondria and the size of the heart and the possibility for your blood to take of oxygen. So there's a kind of understanding, right? But anatomically, it leads to that. So my question is, how is FTP or ATP or anaerobic threshold created? Okay? And that's what I would like to talk to you about in the next couple of minutes. Okay?
14:49 So why does it even exist? And in order to understand that, we have to do a little bit of metabolic biochemistry, so to speak. Don't worry, I'm not going to bore you with ATP and these kind of things, right? We do it pretty basic. We start with carbohydrates, okay? We start with your muesli, oatmeal, whatever kind of carbohydrates you had, right? Your glycogen was stored in the muscle. And what we're going to do now, we have put a little red lamp, so to speak, on our carbohydrate and we follow it through the metabolism. Okay?
15:26 And what is happening to your glycogen, to your glucose, to whatever, however you want to look at that, when you start to use it in the metabolism, in the muscles, the first thing that happens, it goes into something that's called glycolysis. That's the first part. It's eight steps, approximately, and it takes the glucose, and what comes out of that is lactate or pyruvate. Okay? Some people may raise hand. It's like, ah, it's not lactate, it's pyruvate. Yeah, if you look into the textbook, it's pyruvate. Under in vivo conditions in the muscle, at the temperature of the muscle, at the pH level in the muscle, the equilibrium between pyruvate and lactate is 95 to 93% on the side of lactate.
16:10 So if somebody wants to call it pyruvate, I call it lactate, whatsoever. It's one step to go from lactate to pyruvate. It doesn't require energy. It's super fast. It's not a bottleneck. So you don't have to care. That's the bottom line. You don't have to care if it's pyruvate or lactate. Okay? And what I would like you to understand is this always happens, no matter of the intensity, no matter if you sit here, lay in your bed, walk your dog, or do a 100-meter sprint. Every time you want to use one single molecule of glucose or glycogen, it's going to go into the anaerobic part of the metabolism called glycolysis. Always. Okay?
16:52 It's always happening. There's no other way. Okay? And now, what is happening, and the second step is that this pyruvate or lactate, which is a nice, very nice fuel, right? Think about it as a fuel, is entering the aerobic metabolism. Everybody knows you need to add oxygen, right? And then, and then, you get a bunch of energy out of that. Okay? So this is what happens to your muesli when you go riding your bike, so to speak. Okay? Now, what is also happening, there's a little bit of energy production associated with the production of lactate as well, which people know from when you sprint, anaerobic energy, that's basically happening here. Okay?
17:39 So, how you can look at this is basically as two production belts. The one production belt is taking your glucose and makes lactate out of it. The other one takes the lactate and adds oxygen and burns it, simplifying it. Okay? And, yeah, that's an example of the production belt. You have a small pile of that lactate in between those belts because you need to feed the second belt. Okay?
18:06 Questions so far? Okay, everybody with me? Good. So, now, we are looking, I would like to look at how this system changes and this system changes under load. And one example is that this first production belt is significantly smaller or, so to speak, runs at a significantly lower speed than the second one. So, basically saying the amount of fuel which is needed in the aerobic metabolism is much, much bigger than the amount of fuel you get out of the first production belt. Right? In this case, your pile of lactate would be very low. You would measure a pretty low lactate concentration. And because there's a certain amount of fuel that you need, but it's not met by what comes out of the first production belt, the missing part, the missing gap, so to speak, filled up with fatty acids.
18:58 And this is what people call long, slow endurance, base miles, endurance training, fat training, whatsoever. Okay? That's one possibility how those two production belts intact. Another possibility is the first one is running at a much higher speed than the second one. So, in this case, the production of lactate here exceeds the possibility to take it into the next step. So, what would happen? Lactate would accumulate. You're using any fat? No fat use because your aerobic metabolism is saturated, oversaturated already with lactate. And this is what happens when you sprint, when you do a short maximum effort, and so on and so forth. Okay?
19:49 And now, the third possibility everybody is talking about is when both ballots run at exactly the same speed. And this is what we call an aerobic threshold. Basically saying the production of energy of lactate meets the combustion. Highest steady state possible. Okay? So, now we know a little bit better what anaerobic threshold is, right? What we don't know yet is basically still not exactly how it is created. So, therefore, I would like to look at how these two production belts, so to speak, to stay with that example, behave under load.
20:39 So, when I increase the speed in running or swimming or the power in cycling, what happens, using the same colors here, right? What happens to the lactate combustion, so what happens basically to the speed of this belt, it will increase more or less linear. You know that from lab test, VO2 goes up more or less linear, heart rate goes more or less linear. So, all indicators of aerobic metabolism behave in that way when you have a linear increase in power output. Okay? So, the possibility to combust lactate again, this part of the game, goes up more or less linear.
21:14 Now, the lactate production, this part here, goes up curved linear exponential. And, therefore, this is one part which we can call the crossing point or whatever, where combustion meets production and, therefore, that's your anaerobic threshold. Okay? Still with me? Okay. Now, to summarize a little bit here, anaerobic threshold is basically, therefore, created by the interaction of lactate production and lactate combustion. Right? Which then leads to a stabilization of lactate concentration. Okay. Now, what we don't know is what determines the speed or power output at which this happens.
22:03 Okay? So, the question that I'm asking here, why does this guy here on the left-hand side has an anaerobic threshold and also 400 watts? And why does this guy possibly only have, like, 250? Like, what is the difference? What causes that? And don't tell me you have genetics or lactate or whatever. I mean, what is the mechanism? What metabolically is the difference? Right? What's quantifying that? So, what is happening between those two athletes here is that we looked at this, right? So, we looked at how this is regulated.
22:43 So, in one athlete, this graph might look like this and another one, it might look like this. Basically, the possibility to combust lactate is lower and the production is higher leading to a crossing point at a lower power output. Right? Versus this one. Or, it might look like this one where the possibility of combust lactate is higher and the production is lower and then you end up with a higher power output. So, the regulation basically of those two pathways here determines basically, you know, where the crossing point is.
23:34 And what determines the shape of this curve, what determines if you get the dotted line or the sorted line is basically the maximum capacity of those two pathways. So, you can call it the maximum, the size of the engine, so to speak. Okay? So, in other words, very simplifying it, if the maximum glycolytic flux rate, so the maximum possibility to produce lactate is high, then you get more of a curve like the solid one. Right? If you have a lower maximum glycolytic capacity, then you get more like something like the dotted line.
24:11 And the same is true for the aerobic size. Right? A higher aerobic capacity will lead to a higher possibility of combust lactate because you have more oxygen you can take off. This belt can run at a higher speed. You can combust more lactate. Okay? And the good thing is we can measure that. Remember, energy production, we need to feed an oxygen here, right, in this belt. So, we can use the amount of oxygen as the marker for the amount of energy that is produced aerobically. And this is what people call the maximum, leave us a dot, like a flux rate, of oxygen.
24:54 Butamax, the maximum flux rate of oxygen, is a marker for the amount of energy produced in the aerobic system. Because with every molecule of oxygen, you produce ATP or energy or power, whatever you want to call it. And the same is true on the other side. I just said already, in fact, some minutes ago, which each molecule of lactate that is produced, there is some ATP or energy produced with that. So, therefore, the amount of speed or the lactate production, the VLA max, is associated with the amount of energy you can produce in the anaerobic way.
25:29 That's simple. You could also look at another metric, but the good thing is lactate is pretty easy to measure. Right? You might also use another marker, but lactate is easy to access. Okay? And, so, long story short, the maximum size of the glycolytic system and the maximum capacity of the aerobic system determine the power output at anaerobic threshold. And the nice thing is, it determines, statistically speaking, with an accuracy or determines 97.5% of the variations. So, almost completely, almost everything you see in the power output, 97.5% of the power output of an aerobic threshold is determined by those two metrics.
26:16 The other two, two and a half percent is left to body composition and stuff. Okay? So, basically, if you know those two, you know most of the things you need to know. Okay? So, again, asking the question, what is the difference between this guy and this guy, it is a combination of those two metrics. It must be a higher view to max. Okay? Something we might have assumed. So, a higher possibility to combust lactate and a lower lactate production. It enables him to reach a high power output at crossing point.
26:53 And with this guy, he most likely has one or the other or both, a lower view to max and or a higher lactate production. Therefore, the matching point of those two metrics happens at the lower power output. So, to summarize, again, maximum glycolytic and maximum aerobic capacity determines the power output at threshold. And I want to give you another example, if there are not any questions so far. Another example, let's say we look at rider A and rider B, which might be two amateur recreational riders. And we are looking at the body weight, view to max, view to max and the threshold power.
27:37 And let's say, for the sake of simplicity, they both have the same body weight. 75 kilograms. So, I am saying average body weight for a male cyclist. Okay? And let's imagine rider A has a view to max of 50 and rider B of 63. So, I am putting out normal numbers here, right? Not something like 20 and 90, right? So, just something you would be able to see in a recreational amateur athlete. And the VLA max of rider A, let's say, is 0.3 and of rider B, it's 0.9.
28:07 Again, two metrics, easy to measure, nothing really out of the scope here. Watch what happens then with those two athletes. They would have exactly the same power and ROG threshold. Okay? Well, but of course, their combination, so to speak, the metabolic profile or physiological profile, you want to call that, is vastly different. Even though they show the same threshold power. So, whatever test you put into, 20 minutes test, like a profile test, you might, you will come up with a very similar number. Now, let's look at what changes, what can we do about this power output?
28:52 What would be a good training? So, in rider A, for example, if we would try to increase this VO2 max, okay? Let's say this is our training goal, okay? Let's say we know it, we know it's VO2 max and VLA max, and we decide to increase VO2 max by training. This is what we are aiming for. An adaptation of 50 to 60, so again, nothing totally crazy here, right? 50 to 60 milliliters VO2 max would change his anaerobic threshold by 60 watts. 310 watts, quite significant. I bet most of your clients would take that, right?
29:29 Rider number B, maybe we would say, okay, you know, for recreational, that's already pretty good VO2 max. Right? Let's maybe focus on decreasing VLA max, and again, something you can reach within a couple of months, for example, would be to go from 0.9 to 0.5. It takes three, four months of training and adapted nutrition, then you are there. And this buys him almost the same effect on anaerobic threshold, 300 watts. Not too bad as well. So, long story short, again, like I said in the beginning, trying to understand what is the origin of power, what is the origin of performance you see as the output,
30:13 two different training regimes for two guys having the same anaerobic threshold. So, to summarize that, training for anaerobic threshold at FTP, first it's important to understand the only thing that's happening, either you measure it, either you know it or you don't know it, the only thing that you change by training when you increase or decrease anaerobic threshold or power at FTP is 97.5% you change one of those metrics or both of them. It's more or less the only thing that happens. The other thing is it can vastly, pretty significant in between athletes, right?
30:56 We have seen amateurs with 70 milliliters VO2 max and we've seen amateurs doing the same kind of races with 55, the same full VLA max. Another thing we are going to talk about in the next slides a little bit, the training regimes can obviously have completely different effect on both metrics. Just very simple, think about some very hard sprint training, you might be easy to understand that this might have an increasing effect on VLA max and therefore maybe decrease the threshold or, you know, just to say one example, we come up with some ideas on that.
31:34 But I have to say, at least for my personal taste, if you're really aiming to increase threshold for a type trialist or somebody else, you're going to talk about how important that really is. But if you're aiming to do that without knowing that, as you've seen in writer A and writer B, it's pretty difficult to really know what you should be aiming for training. And therefore, it's a little bit guesswork or a lot of experience that you need to really do it a little bit, you know, try and error.
32:04 Okay. Questions so far? Okay. Now, the question that's coming up very often is how should I train long and easy versus short and hard? And another opinion that I sometimes hear is, yeah, but I can't change VLA max anyway. Right? It's genetic. You're already laughing, right? But I wanted to show us two slides about that to dispel the notion a little bit here. Okay? So, some people really think that VLA max is kind of determined and that's what you have, right? If you're 50 or 50, if you're 60 or 60, you can't change it.
32:44 Right? No matter if you're four years old or 78 whatsoever. So, the truth is you can change it. The upper ceiling might be somehow genetically determined, but you can change it a lot. And just to give you one example, this is a well done study where they looked at twins and they trained twins for a couple of weeks. And you're looking at the change in VLA max. So, one dot, for example, this up here is in twin number A, the training led to an increase of VLA max of 40% and in twin B of 30%.
33:17 So, quite significant increase. In some other twins, not quite significant, but it's kind of correlated. So, how people adapt to the training and how much they increase by training, that is something that might be genetically determined. But that doesn't mean that you can't change it at all. Right? Another example, I hope you can read it back there. It's 4,000 meter per shooter. So, an elite cyclist looking at a time period of six years, September 93 to May 99. And you're looking at, okay, there are some changes in body mass involved.
33:56 But if you look at it's VLA max, it changes from 74 up to 88. There's quite some fluctuations. Right? Some of that accounts for a lower body mass, but also the total number changes from 5.4 to 6.2, which is, again, more than 10%. And at this high level. Right? So, not saying that this is always the case, but again spreading the notion that VLA max is something you can't change anyway. And it's a little bit ironic anyway, because you might say, oh, I can't change VLA max, but then people doing so-called VLA max intervals.
34:32 You know, it's like, it's a little bit ironic here. Okay. So, we wanted to talk about how to train VLA max and talking about this difference in long and easy, rather short and hard. And I'm not going to present five or ten different training protocols. I wanted to provide some general understanding behind that. And in order to do so, I need you to come with me on the same page in terms of different muscle fiber types. So, some of you might be aware of that. Just to repeat, we have simplifying more or less three different muscle fiber types in the body.
35:20 This is a slow twitch. Okay, somebody recognized the Red Sox one. This is a slow twitch, more like an endurance kind of fiber with a high aerobic capacity and a low lactate production. And then you have the fast twitch, so the more powerful one with a higher force production. So, you have the fast twitch oxidative, which are fast and can produce more power, but still have a good aerobic capacity. And then you have the fast glycolytic, which can produce a lot of power, but have a lower aerobic capacity, but produce more lactate.
35:52 So, energy production comes from glycolysis. Okay? So, these three fiber types. So, why is this interesting? Because think back what we said ten minutes before. We talked about aerobic capacity and glycolytic capacity. So, we said the amount of lactate produced is directly related to, you know, your glycolytic power. And now, lactate production happens more or less mostly in the fast twitch fibers. So, we have some numbers, we have some statistics because we did tons of muscle biopsies, but there's still a big variation. But in general, you could think that, and it's true, that if you have some athlete with a higher VLA max,
36:33 he most likely has a higher amount percentage of fast twitch fibers. Okay? And if you have somebody with a low VLA max, obviously it's the opposite. Okay? So, that's important to understand because now in the next slide, that's one very classic one in sports science, and this is why I bring it up, we are going now to look at these three muscle fiber types, okay, and how they adapt to endurance training. So, this is this one. Let me give you a quick walkthrough because it might look complicated on the first lens.
37:05 On the x-axis, you have the intensity as a percentage of VLA max. Okay? So, 73 to 83% might be somewhere in the range of threshold. Below that goes more like towards whatever speed spot or fat max. Then obviously about 100% is about 100% field view to max. And then 160% is more like what we would call these days HIT training or high intense interval, stuff like that. Okay? And what you see on the y-axis is cytochrome C. You can forget the name immediately. It's a marker on the amount of mitochondria or the activity of mitochondria.
37:44 So, mitochondria is basically where the aerobic metabolism happens. So, long story short, y-axis shows you a marker of the aerobic capacity of the muscle. Okay? So, it's the adaption of the muscle. Okay? After, I need to look it up, I have to admit, some several weeks of training at those intensities. And what we're looking at here is a white vastus muscle. So, white vastus is one that is primarily fast twitch glycolytic fibers. We're looking at the soleos, which is primarily slow twitch fibers. And we're looking at the red vastus, which is kind of a mix, something in between.
38:26 Okay? So, what you can see is that primarily fast twitch glycolytic fibers, if you increase training intensity, you get a much bigger response in terms of adaptation of Biotomax or aerobic metabolism. Okay? So, the fast twitch sprinter kind of high glycolytic fiber, if you put a lot of high intensity training into it, you will see a very good reaction. If you take the ST fiber, the more slow twitch kind of guy, so to speak, with increasing intensity, you get a better response, and then it goes down again.
39:08 Something, by the way, very good visible NGC kind of elite cyclist. Okay? And obviously, if you have a mix, right? If you would put those two together, if you have a mix, with increasing intensity, you get a better response, and then it kind of doesn't change anymore. Right? So, what this tells you is, a little bit, again, it's not a 100% precise number in terms of, oh, this is your muscle fiber distribution, but if you have a guy with a low VLA max, a high VO2 max, or at least a low VLA max, you know that he's not most likely the white vastus guy.
39:45 He's more like the soleus guy. So, if you put a lot of high intensity of it, it might not really work very good. And then the opposite is true. If you have more like a sprinter kind of guy, you might see very good responses with the training intensity. Okay? So, this is how this approach with VO2 max and VLA max has been successfully used in elite cycling in the past. And to bring it full circle, think about it. This one also explains you why a training you did two years back with an athlete maybe doesn't work today anymore.
40:20 One of the common mistakes is, you have a training program that worked, and you kind of repeat it and repeat it and repeat it and the effects are not the same anymore. So, imagine you start out with somebody, you start coaching somebody, and it's more like the fast twitch kind of guy, right? Not very good at your, it's adapted yet. So, you put some intensity on your, because it's time crunch, doesn't have a lot of time, and it works really well. Now, what's happening, the fiber types adapt.
40:49 So, he gets a little bit less fast twitch, but more slow twitch, and now, the effect for the high intensity training is not the same anymore. Right? So, can change quite a lot. Okay? Okay. So, we talked a little bit about VO2 max, hopefully get you some basic understanding how we increase aerobic capacity. Now, we need to talk a little bit about VO2 max, put this picture by the way, because his coach is using this parameter ever since. So, because we're going to talk a little bit about why VO2 max is, you might think, oh, it's a glycolytic parameter, it's anaerobic.
41:30 I don't care to coach a pyramid triathlete. We're going to talk a little bit about why it's important for a pyramid triathlete as well. So, first thing I wanted to show is a comparison of professional and amateur cyclists. And, that's a group, I don't know, 30 athletes total or something, and they had a difference in anaerobic threshold power about 120, 130 watts. Right? So, a shade below 300 and a little bit above 400 on average. And, this difference in power, if you look at the difference in VO2 max and VL-Mx, the difference in VO2 max between those groups was only approximately 22%.
42:14 That means that's pretty easy. Professional cyclists somewhere in the range of 80, right? And, an amateur somewhere between, whatever, 65, 22%, pretty easy. Now, the difference in VO2 max is almost 100% in average. Right? So, the glycolytic capacity of those guys can be vastly different. So, long story short, the 120, 130 watts and threshold difference, you can't explain that only by saying, oh, he has a higher VO2 max. That's only part of the story. Okay? And, I wanted to give some examples. So, what is a high, what is a low VO2 max?
42:56 So, if you're looking at a sprinter, in this our example, 80 kilograms, 77 milliliters VO2 max, so elite athlete. And, if you look at a high VO2 max for road cyclists, in our example, would be approximately 0.9. A medium one would more be in the range of 0.5. And, a low one would be more in the range of 0.3. In other words, you could say this is your top-end sprinter, because 0.9 milliliters, middle-mall of VO2 max is approximately 1000 watt glycolytic. If you add whatever comes out of the other systems, this guy would have a top power and sprinting about 1700 watts.
43:39 The medium guy is more like your classic rider, and then the low one is more like a GC or climber or TT kind of guy. Okay? Just to have ballpark and idea of what is the BLMX level. Okay? So, we're looking at a little bit of a little bit of a little bit of a little bit of a little bit of a little bit of a little bit of a little bit of a little bit of a little bit of a little bit of a little bit of a little bit of a little bit of a little bit of a little bit of a little bit of a little bit of a little bit of a little bit of a little bit of a little bit of a little bit of a little bit of a little bit of a little bit of a little bit of a little bit of a little bit of a little bit of a little bit of a little bit of a little bit of a little bit of a little bit of a little bit of a little bit of a little bit of a little bit of a little bit of a little bit of a little bit of a little bit of a little bit of a little bit of a little bit of a little bit of a little bit of a little bit of a little bit of a little bit of a little bit of a little bit of a little bit
44:23 So, this is a little bit of a little bit of a little bit of a little bit of a little bit of a little bit of a little bit of a little bit of a little bit of a little bit of a little bit of a little bit of a little bit of a little bit of a little bit of a little bit of a little bit of a little bit of a little bit of a little bit of a little bit of a little bit of a little bit of a little bit of a little bit of a little bit of a little bit of a little bit of a little bit of a little bit of a little bit of a little bit of a little bit of a little bit of a little bit of a little bit of a little bit of a little bit of a little bit of a little bit of a little bit of a little bit of a little bit of a little bit of a little bit of a little bit of a little bit of a little bit of a little bit of a little bit of a little bit of a little bit of a little bit of a little bit of a
44:53 So, come May, about this time of the year, basically, everything is going down lower. So, VLMX is even lower because he's getting tired maybe, aerobic capacity is also going lower. Okay? So, basically, because lactate production decreases and combustion also decreases, the threshold doesn't change a lot. Now, this is too low for him. So, we pull him out of the races and we apply some sprint training. Okay? And what's happening? You can see VLMX goes up, VLMX goes up, the training worked. Obviously, right? I only bring this one example that happens where it worked and all the other 99 cases didn't work. No. So, this is what happened here and then comes the Tour de France. So, for Tour de France, everything is super good. Higher glycolytic capacity, higher aerobic capacity. Comes the Tour de France.
45:47 After the Tour de France, he's tired, everything is down again. It's a matter of effect on the Champs-Élysées for most of the sprinters, the sprint power is 200 watts less than on the first week. Everybody has a decreased glycolytic capacity. Okay? Now, one thing to note is here, or the takeaway message is, first, it can differ during the season quite a lot. Both metrics. Right? And it can be independently. Both can go up simultaneously or one can go up and one can go down. It's not connected. Right? It's anatomically different. Mitochondria, it's a different spot in the muscle cell as the glycolytic part is happening. Even mitochondria has partly its own genome. So, just to give you an understanding, these two systems are kind of separated.
46:31 And the other takeaway message is, look at what changes in his anaerobic threshold. So, threshold power, for example, in the Tour and after the Tour is about the same. Something very commonly known. The rider comes from the Tour de France, he has the endurance. He can follow every race. You can put him in every race you want. No problem to follow that race. But he neither has the maximum glycolytic nor the maximum aerobic capacity to do the top end stuff to pull something off. Right? Another example, how this affects performance in arrays. We have two graphs here, two lines. We're basically looking at the power output and we're looking at the accumulation rate of lactate.
47:25 So, how fast lactate accumulates. And we have rider 1, which is a dotted line. And we have rider B, which is a, sorry, rider 1 is a solid line, rider B is a dotted line. That's two real world examples of virtual cyclists. Okay? So, first thing I want you to notice is that the power output at which lactate accumulation is zero is about the same power, which means they have more or less the same anaerobic threshold. Okay? And they have more or less the same body weight. This is why I took those guys, because it's good to compare. Okay?
48:00 Do I have to admit that rider number 2 has a slightly different body composition, yet a slightly lower fat mass, but that doesn't change a lot. So, basically, same threshold power. This guy, kind of low VO2 max, kind of low VL max. This guy, both things more on the higher end side, having the same anaerobic threshold. Now, I've noted before, maybe anaerobic threshold is a little bit overrated anyway, how important it is. Let's say we put those two riders with the same anaerobic threshold at the power output above threshold, and let's say we do it at 450 watts, just as an example.
48:38 At 450 watts, rider number 1 accumulates 2.6 millimoles per minute, and rider number 2 only 1.6. Maybe it doesn't tell you a lot. Well, if you do that for 5 minutes, rider number 1 ends up at 30 millimoles, and rider number 2 only at 8. And for somebody with this profile as rider number 1, we can doubt that he's maybe even able to reach Strutti Millimoles. But rider number 2 might, you know, raise his head and say, okay, what's next, coach? Right? So, yeah, same threshold, what's happening above, but is much more important for any kind of road race, criterium, professional race, amateur race.
49:21 That's a whole different story. Right? Okay. So, some ideas about training. How do we change VO2max? How do we change VLMx? To be honest, 15, 16 years ago, we developed a test, an ergometer test in the lab to directly assess VLMx. We verified his muscle biopsies and so on and so forth. And the first idea about training was, hey, just go long and easy. Right? It's glycolytic, so don't touch it. When you don't touch it, it will decrease. Right? It will de-adapt. The truth is that's not happening.
49:58 You looked at it before that you have different muscle fibers. The VLMx mostly comes from the fast twitch ones, and they have a higher threshold of intensity to even get recruited. So, if you don't recruit those guys in training, you cannot expect them to adapt. Okay? Just to give you some examples. So, long slow distance, obviously, if you increase it a lot, it normally has a good effect on VO2max. Right? I mean, it's pretty easy. Just write more. Best training advice. It's just not possible for everybody.
50:30 It can have both effects on VLMx. Right? Meteor or Sweet Spot might have a good effect on VO2max. Because it's a higher intensity, same as, you know, high torque, low cadence efforts, can have a very good decreasing effect on VLMx. So, be careful if you have a sprinter. Maybe that's not what you want to do. Threshold kind of intervals may have an effect, may not. High intense stuff, very critical. You recruit those fibers, but you apply an endurance exercise to them. So, kind of different. Low carb training, something very strong, very strong effect on VLMx.
51:09 And then, obviously, sprints and weight training, very low VO2max. Well, for an untrained, it might have a positive effect. This arrow, you know, relates more to a highly trained one. And then, on VLMx, obviously, it can have a good effect. Okay? Just to provide an overview. Okay? Okay, talking a little bit about individual interval training programs, just really quick. Because I choose this one because it's very interesting for a lot of the coaches. Truth be told, it's not a problem for us to describe an interval training program and say,
51:44 I want you to write four minutes or six minutes at power output. When it comes to, you know, putting or prescribing the resting period, the duration and the power output, it gets a little bit like, ah, maybe like this, right? It's like, okay, four by four minutes. How much resting? Eight minutes, nine minutes, five minutes. Let's do six. It's easier to calculate, right? I mean, truth be told, that's often how it works. So, what is possible now, what you can do is, you can use, for example, this one,
52:14 which has been used quite a lot, ah, successfully, to train lactate metabolism. Um, you're looking at the lactate accumulation just as we did before, but now we're looking also at what's happening below that, which is the gray part of the curve. So, the gray part of the curve shows you how quickly the athlete can get rid of lactate. It goes to zero at threshold, and above threshold, you accumulate. So, what is possible to do is, to really define precisely, okay, what is my accumulation rate? For example, if I accumulate this amount of lactate, I go to the left and say, okay,
52:51 if I write here for one minute, I have the same combustion rate at which I accumulate. So, if I write at the same time, doing that kind of over-unders or revolvers, or whatever you want to call that, right, I can now define very precisely what the power output would be. Or you can play around and say, okay, let's go to higher power output, where I accumulate double the amount of lactate, but then I need double the time for recovery. Very simple, right? So, you can pick any power output on this graph,
53:21 because you know you want your athlete to train whatever. Three minutes, thirty seconds at X, Y, Z power output, because that's what you think he needs in the race, and then have a look on, you know, what is the duration for full recovery or not full recovery, and so on. And this has been successfully used in elite cycling a lot, because you know that races, it's not like a steady-state power, it's always riding above threshold, below, attacking and recovering. So, lactate is shuttled, so lactate carriers, lactate shuttles can be trained,
53:54 lactate buffering is important, and this whole process of using lactate as a fuel, that's something you want your athlete to be able to do, and this is what you can see in this graph. Okay? Okay, and this takes me to the nutrition part. Okay? We said we talked a little bit about nutrition, so what we are looking at and what we are using for determining training intensities for, like you know, this one we use for training intensities for the interval training, and what we can do to determine training intensities more for the endurance part,
54:30 is basically the fat combustion rate and the carbohydrate combustion rate. So, this is an example now from running, could be cycling or whatever. So, basically your fat combustion rate has like an apex, has like, you know, a maximum rate, which you can call the fat max, and maybe it might be a good advice of a training to, might be one training method to train here. And then carbohydrates, just to bring everybody on the same page, obviously the pressure is full, because the glycogen stores are limited, and the uptake rate is about 60 to 90 grams per hour maximum.
55:06 Okay? That's the maximum uptake rate, and that's not referring to how much food your athlete can stuff into his mouth, it's about how much actually can be taken up into the muscle from the bloodstream. So, this is the bottleneck here. Okay? So, that's 16 to 90 grams. Okay. So, I wanted to tell a little bit, talk a little bit about why VLA max is important in endurance athletes, for example, in Ironman triathletes, why, how it is used successfully. I mean, we have talked about it, that obviously it's important for the sprinters,
55:41 because it enables higher sprint power. Now, in this example, we have an 80 kilogram athlete, 60 view to max, so typical recreational amateur athlete, and we are comparing fuel contribution with a low VLA max of 0.4 and a little bit higher one of 0.7. Both metrics, something you might see in your athlete. Okay? And the dotted line is a 0.7 and the solid line is a 0.4. So, what you can see is that the power at fat max, for example, and how much fat, how much calories are used,
56:18 it's vastly different in between those athletes. Right? Or, to talk more about carbohydrates, what is maybe more important for the race fueling, in this example, at a power output of 225 watts, we are talking about one power by extra power. Same power output, same athlete, you know, the one basically adapted to a lower VLA max. Okay? So, this is why it's so important for, like, yeah, ultra endurance athletes, Ironman, marathon runners, and so on and so forth. Right? And, just if you may ask, okay, why is that, and how is that happening?
56:57 Okay. So, just to bring it back, remember, some slides before we said, the VLA max, so the maximum glycolytic capacity determines the glycolytic production rate in steady state or in whatever endurance conditions. So, if you have a higher maximum lactate production rate, the lactate production rate will be higher in whatever condition. And now, what is the source of lactate? What is the only source of which the body produces lactate? It's glucose. So, if you have a higher lactate production, you use more glucose, you lose less fat.
57:29 Simple as that. Okay? And, I want to bring this one example. This is, for me, it's kind of a nice story. This is one of my former athletes, Joe Spintler. He was a professional Ironman triathlete. Now, he's a very successful coach of the Brett Sutton group. And, he uses this, for example, for pacing in a marathon. So, not talking only about cycling here. So, he uses it in a marathon to, you know, to pace as athletes. So, in this case, they were trying to break three hours.
58:02 So, quite a comprehensive goal, I'd say. And, what they basically did was, they did some simple testing, come up with this curve, and say, okay, we want to run a pace of 408 per kilometer, right? Which is 4.03 meters per second. So, this is this arrow here. And, would lead to a time just a little bit below three hours. And, he came up and said, okay, well, my carbohydrate combustion is 190 grams-ish. So, after three hours, I would need a total of 560 grams. My athletes, that's simple as that, weighs 75 kilograms.
58:41 Assuming about 40% muscle match, this is something you can easily pull from your Walmart body fat scale or whatever. It's not rocket science, I'm saying here. You can assume that he's approximately 450 grams of carbohydrates. And, therefore, if you would only substitute 120 grams, which is not a lot for three hours, right? That's kind of playing a safe. And, that's what they did, by the way. The first hour was only water. It's another topic because as long as you have full glycogen storage, the body doesn't use that much of, so to speak, external glucose.
59:16 So, the first hour was more or less only water. And, then they substituted 60 grams of carbohydrates an hour, which they tried before a training. Okay? And, of course, again, I'm only putting up the rare examples which work. He ran exactly for 254. By the minute or by the second. That's exactly what, what, what printing did. And, just, you know, to give you an idea how people use this in their coaching. Okay? Who played around or who uses low carbohydrate, high fat diet, ketogenic? Okay. Something that's getting kind of more popular, has been getting very popular.
59:56 Okay. So, I wanted to bring this into this because, obviously, it's something that can be used to reduce VLMX. And, first, starting off, showing where it comes from, one of the studies where this comes from, again, give you a little walkthrough here. This is, on the y-axis, again, a marker like we had before with the different muscle fiber types. This is a marker for mitochondria activity. It's a key enzyme of mitochondria aerobic metabolism, citrate synthase. Okay? So, long story short, y-axis, adaptation of aerobic capacity of the muscle.
1:00:34 And, we have one training group doing a training program with, like, a mixed diet, which is called the control group or CON. And then, we had one group doing the same, one intervention doing the same training on a high fat diet. And, we had one group doing the same training alternating high carbohydrate, high fat. Basically, what you can see is, well, the adaption of aerobic capacity in the muscle is much higher with the group, with the high fat or high, or alternating diet. And, this is one of the studies this whole hype kind of high fat diet comes from.
1:01:14 Okay? So, muscle-wise, it seems to work very good. So, lately, there have been more studies showing that it's maybe not, maybe doesn't have a positive effect on performance. And, one of the studies that's very well made is this one. So, now, instead of looking into the muscle, we look at the actual performance outcome. And, as a performance outcome, we did, it was done a 100-kilometer time trial on ergometer. So, basically, the time refers to the power output because the resistance is set. Okay? And, we have a much smarter design of the study because we have, like, you would do, pros likely, something like a train low, compete high.
1:01:56 So, high fat diet during a training period and then the carbohydrate feeding just before the test, which is the bar on the left. And, the other group is high carbohydrate throughout and then the high carbohydrate feeding. Okay? And, I'll see what's happened to the writing time. So, basically, the performance in the 100-kilometer time trial. The group, all the time training on high carbohydrates, performs better. And, six months ago, ten months ago, approximately, the first publications of the so-called supernova study came out from down under. One of the biggest things, one of the biggest projects in this area, very well done.
1:02:39 Showing, in average, you know, the same kind of effects. Low fat diet might inhibit training adaptation in terms of the total performance outcome. Now, what is important to understand and what I would like to warn, so to speak, a little bit is, when we read about high fat diet, whoever does it, just this GC rider does it, Team Sky does it, Froome does it, who whatsoever. So, it's important to understand that in elite cycling, and it's not bashing here, amateur training or whatever. In elite cycling, the goals and what we read out in elite cycling is different what you read out.
1:03:22 So, putting myself in your shoes, running a coaching business, coaching athletes, I'm interested, does it work in general? If I apply to 20, 30 athletes, does it work? Now, in elite cycling, we don't care if it works for 30 athletes. You can see here, each line, it's one individual athlete. So, there are two, three athletes who benefit from this diet. And, I don't care about the average. If one of these outliers is my captain of the team, I want this diet. And, then you can read about it in the newspaper.
1:03:53 It doesn't mean that you have to copy it. Okay? So, from my personal experience, with some elite riders, especially the GC guys and TT guys who have very low carbohydrate combustion, this kind of high fat diet can work pretty good for some time. And, it's a very powerful, very strong tool to decrease VLA max if you think you need it. Okay? It doesn't mean that you just can put it into everybody and it works. Because, especially when you have somebody with a high carbohydrate combustion rate, it might fire back in performance.
1:04:34 Very easy. Like, it's a very small area. It's a very, you're really going into the edge because if you're doing too much training, then carbohydrate combustion is too high and performance will draw. Also included into this study, very well done, again, they didn't only do the 100K time trial, but they included 1K and 4K all out efforts to really mimic the race. Again, very close to realistic conditions. And, this is the same two groups and long story short, the high carbohydrate groups perform better in both the 4K and the 1K intermediate sprints.
1:05:10 Okay? In average. Again, not talking about the outliers here. Okay? Questions so far? Okay. Then, going to the last topic. Sharing some lessons learned in, yeah, basically, so to speak, running my own coaching business. So, when I started with, in this time, still T-Mobile Team 2006, I founded my own lab in Cologne to do a lot of these testing with a lot of these methods which you have just seen. BLMX and lack of pyro weight and lactate accumulation and stuff like that. Okay? And, I think it's important to understand that, especially in Germany, there's basically no coaching business without lactate testing.
1:05:58 Right? I mean, Germany has, I don't know, 45 different lactate protocols. Everybody needs to have his own one. They are more or less all the same, but whatsoever. So, when we started, this is a map of the city Cologne. Each dot is at least one testing coaching business. When we started, our little steps in here was like one out of eight or whatever. Okay? So many labs. And, some years later, this is what the map looked like. Basically, everybody else was out of business. And, I have to say I'm proud.
1:06:33 I don't own it anymore. But, and since I don't own it anymore, it's going better. But, the truth is, it's one of the fastest growing and biggest coaching successful companies. Maybe not only in Germany, but maybe even Europe. Three facilities doing more than 2,000 tests a year. Coaching, working with virtual teams, working with, you know, Race Across America athletes, triathletes, whatsoever. You did whatever bike fittings for Jan Frodeno and MovieStar and everything. And, I wanted to share some of the lessons why I think this happened. Okay?
1:07:12 And, one key, what I've learned in doing this for 10 years almost, is especially with the arrival of the power meter as a training tool in cycling. If I compare what, you know, a classical lactate profile test does to your typical, whatever, you can do the 20 minutes or doesn't, I don't care, right? It's whatever power profiling kind of thing, which Natalie does versus what we did, what, you know, what is similar to now in the software. First thing is accuracy of determining anaerobic threshold. Most of the lactate profile tests are somewhere in the ballpark of 10%, truth be told.
1:07:52 Running is more like 5%. There are not so many studies, by the way, about the 20 minutes test. By the way, everybody uses this. There's one study coming out showing that out of 18 athletes and 10 athletes, it's not possible to detect anaerobic threshold with a 20 minutes test. So, it will be published soon. What did you say, either 8 to 10? 10 out of 18 is not possible. So, it's a little bit above the half. There's no statistical correlation between 20-minute power output or 95% of 20 minutes over there.
1:08:23 And so, what we did 10, 15 years ago, which then what was used by Highroad, one of the reasons was that our accuracy to determine any threshold was much higher. And obviously, if you are in elite cycling, one second. If you are in elite cycling and you're looking for 2-4% of changes in power performance, 2.3% is a good accuracy. What's the gold standard for the threshold? The gold standard is what we looked a little bit about. It's 30 minutes, steady state. So, you're looking exactly at the electric.
1:09:00 Yeah, so that's kind of the accepted gold standard. It's a nice question. So, that would be just everybody's on the same page. You have an idea of what you think the threshold is and you put somebody on an ergometer and this is how these comparison numbers come from. It's against the gold standard, which is 30 minutes, steady state power, looking if lactate stabilizes or increases. Now, the problem with that is there's a nice study currently conducted where they have an intelligent ergometer, which adjusts the power output by 3-4 watts based on how the lactate chain is.
1:09:32 Remember, I said half an hour ago, lactate threshold is a blurred line. So, what is happening is, I don't want to go too deep, but what is happening is, if you ride a little bit above threshold, you accumulate lactate a little bit and this inhibits glycolysis, so therefore lactate production goes down, so you can come up to a steady state a little bit higher. Long story short, even with the gold standard, you cannot determine an aerobic threshold with a resolution lower than 5 to 7 watts. That's the resolution which you maximum can reach.
1:10:05 Is the metabolic profile with the 2.3%, is that with the various inputs? Yeah. On the critical power? No, this is just based on VLA max and VO2 max. Oh, okay. Right? For whatever this comes from, from the direct VO2 max measurement or a critical power test or lactate test, whatever, however you come up with a correct VO2 max, you can calculate a normal resertial with that accuracy. Okay, and then, so I'm doing some comparison here. The select rate profile test, you don't really get a VO2 max, an approximation maybe.
1:10:39 Out of a, let's stick with a 20 minutes test, you really got no idea what your VO2 max is. If you obviously measure it, you measure it, you have it. VLA max, kind of the same thing, you don't really get it. Fat and carbohydrate combustion, you would need to add it with a metabolic heart to a lactate profile test to have a grip on that. Obviously, with a 20 minutes test, you don't get it. Lactate accumulation rate, these things we looked at, you don't get it. Recovery times, so how quickly you can get rid of lactate, nothing you get from those tests.
1:11:12 Projections, something I'm going to talk about in a bit, like projecting, like we did with the carbohydrate combustion, with the low and high VO2 max, something you can't do out of those tests. And then the time demand, the lactate test more than 30 minutes, FTP tests or critical power, different ones, 20 to 60 minutes, and the metabolic profile, like we are doing it, 40 minutes. Now, the critical part for a coaching business, coming back to the question, why I think why so many coaching businesses in Germany went out of business doing normal lactate testers,
1:11:45 you need a coach or an expert or a lab to do a lactate profile test. And for the 20 minutes or critical power test, you don't need one. Obviously, every athlete can do it himself, right? Get any software, WKO, go and cheat or whatsoever, and do it manually or whatever, and you have, I mean, 95% of 20 minutes power output is not really rocket science, right? Everybody can do it very easily. So what I'm trying to say here is, if you compare those two ones, there's not so much added value, really,
1:12:16 in me going into the lab and performing a lactate test. I mean, what extra information do I get that I can't get alone out there with the power meter? It's not real at all. So this is what I think put us, with the STEPPS lab, in a much better position because it's either you're doing it yourself or you come to the lab, but the lactate test really doesn't add a lot of value to that. Okay?
1:12:48 Okay. And so this brings me to some of the key findings or the key understandings and takeaways I got there. What was happening now at STEPPS was that we would give some clear, you know, advice, something that people can't get themselves, right? Fat combustion you don't get from critical power test. VLMX you don't get it normally and so on and so forth. So added value, that's what happened. And the other thing is providing a clear link between your test data and applying it to training and racing.
1:13:28 I always said, like, nobody comes to my lab to know his ventilatory threshold too, right? Nobody cares. The only, I mean, nobody spends money on that or spends time, right? You want to know how to train better, how to race faster. So if I can create a clear link, for example, this fueling of some aerosol runner, if I can create a clear link and say, okay, this intensity you need to eat one power bar per hour, that's something easy to understand and directly apply to training. Okay?
1:13:57 And this has been a very big asset for us. So providing data somebody can execute on. Next thing is providing clear and measurable targets. You know, I started out, and this is part of how the whole story started, I started out doing lactate profile tests. And then three months down the road, you know, prescribe a training program, three months down the road the athlete comes back and you have more or less the same curve, right? But you just sold him the service for I don't know how many bucks.
1:14:28 And you start to, oh, but there's this funky kink down there at 200 watts, so I think you should be doing more endurance training. I mean, truth be told, these days all the athletes are very educated, especially the guys who are into numbers. They are pretty intelligent. They know, you know, the real person numbers, they read about it. So everything that's kind of in the dark or in the gray area is very difficult to talk about or to sell to your athlete. Now, if you have a clear view to max and a clear running economy or threshold very precisely,
1:15:02 but you as a coach are much more accountable, right, for what you're doing, but you have, you can provide clear measurable targets. Basically, going back, think about this carbohydrate combustion curve. So let's say we're shooting for less carbohydrate combustion, higher fat max, and we are able to show that a lower VLA max does this, right? Or we had this example of rider A and rider B where we said jumping from 50 view to max to 60 by 60 watt of threshold power. Now, when I can show this to my athlete after a test before he conducts a training program, and I say, hey, if you go get your VLA max from 50 to 60, this by 60 watts, the next question is, okay, what's the training program for that?
1:15:47 So here you just sold your training program. And, of course, you sold your following up test, which is what happened to steps. We had a customer retention rate of 80%. Because once people measure it, and you can say, okay, here's what you need to do. To do that, it takes about whatever, three months to change your VLA max, and you should come back. People come back and they want to know. So you are accountable. And the next thing that happens is the motivation and the buy-in into the training program is different.
1:16:18 If I'm an athlete and I know I need to get my, whatever, VLA max down to save the carbohydrates for my marathon run, or I need to get the VO2 max up to increase my anorexpressure power, and my coach just told me it's about whatever, it takes two or three months' time, even if it's raining like today, if I have my training program, I go out and I know what I'm doing it for. You know, it's the motivation of the people for so much better. Okay? So, and this is kind of the outlook.
1:16:49 So what we are able to do now, we are able to calculate precisely what will be the threshold power, what will be the carbohydrate combustion rate. So this is why I have this picture here. We basically put the carrot in front of our athletes here. Okay, this is what you need to do. Right? And this, again, helped a lot with the buy-in. So one example would be how VLA max changes FEDMAX, selling a training program for lowering VLA max. How, for example, we can use carbohydrate as a race fueling.
1:17:20 It's an example how we can apply data to training and racing. Like we said in rider A and rider B, changing VLA max, what kind of effect does it have on anaerobic threshold. And another thing we could talk about, for example, running, how running economy changes marathon time. So all of these is what we did and what basically was part of the success story, having higher customer retention rates and providing added value with people could not get from the normal FTP testing. And hereby, opening up for questions.
1:17:59 Yeah, and a quick wrap up for anyone that's listening or joining us on the live feed. We can take- We can take- We can take- We can take- We can take- We can take- We can take- We can take- We can take- We can take- We can take- We can take- We can take- We can take- We can take- We can take- We can take- We can take- We can take- We can take- We can take- We can take- We can take- We can take- We can take-
1:18:34 We can take- We can take- We can take- We can take- We can take-