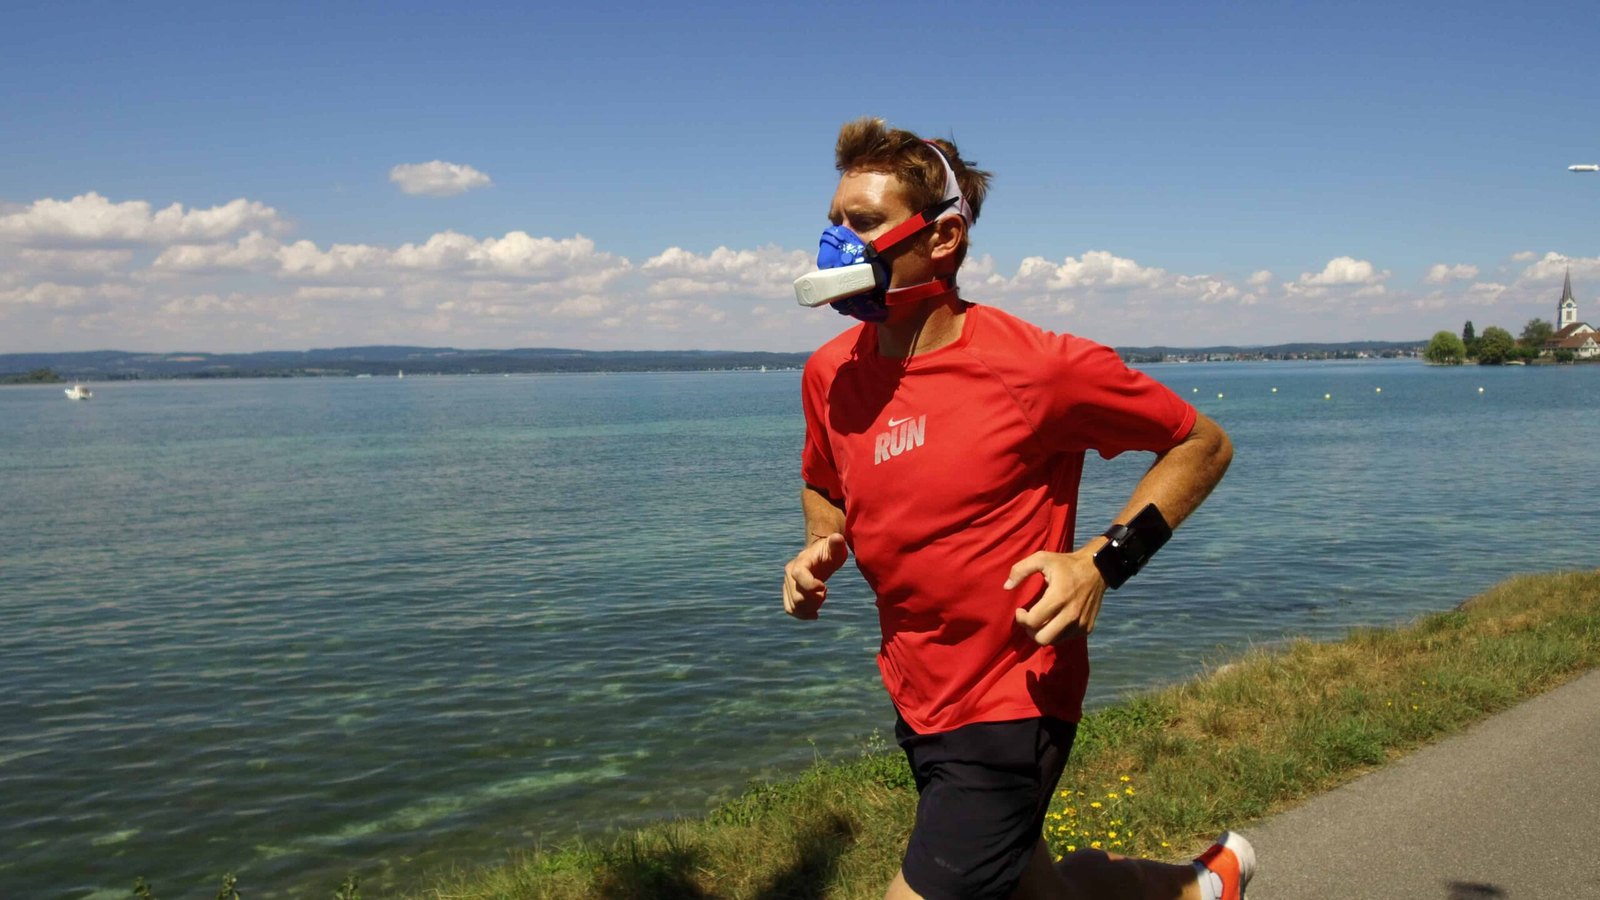
Knowing VO2max and VLamax reveals how fast lactate accumulates above threshold and clears below it, enabling coaches to calculate exact recovery pace, work-to-rest ratios, and optimal interval intensity for each runner.
In the previous blog we talked about the importance of knowing fundamental running metrics like VO2max, VLamax, Fat combustion and Carbohydrate combustion. We saw how knowing those metrics makes you a faster runner instantaneously. In this blog we’ll show you how knowing your lactate accumulation and recovery will optimize interval training.
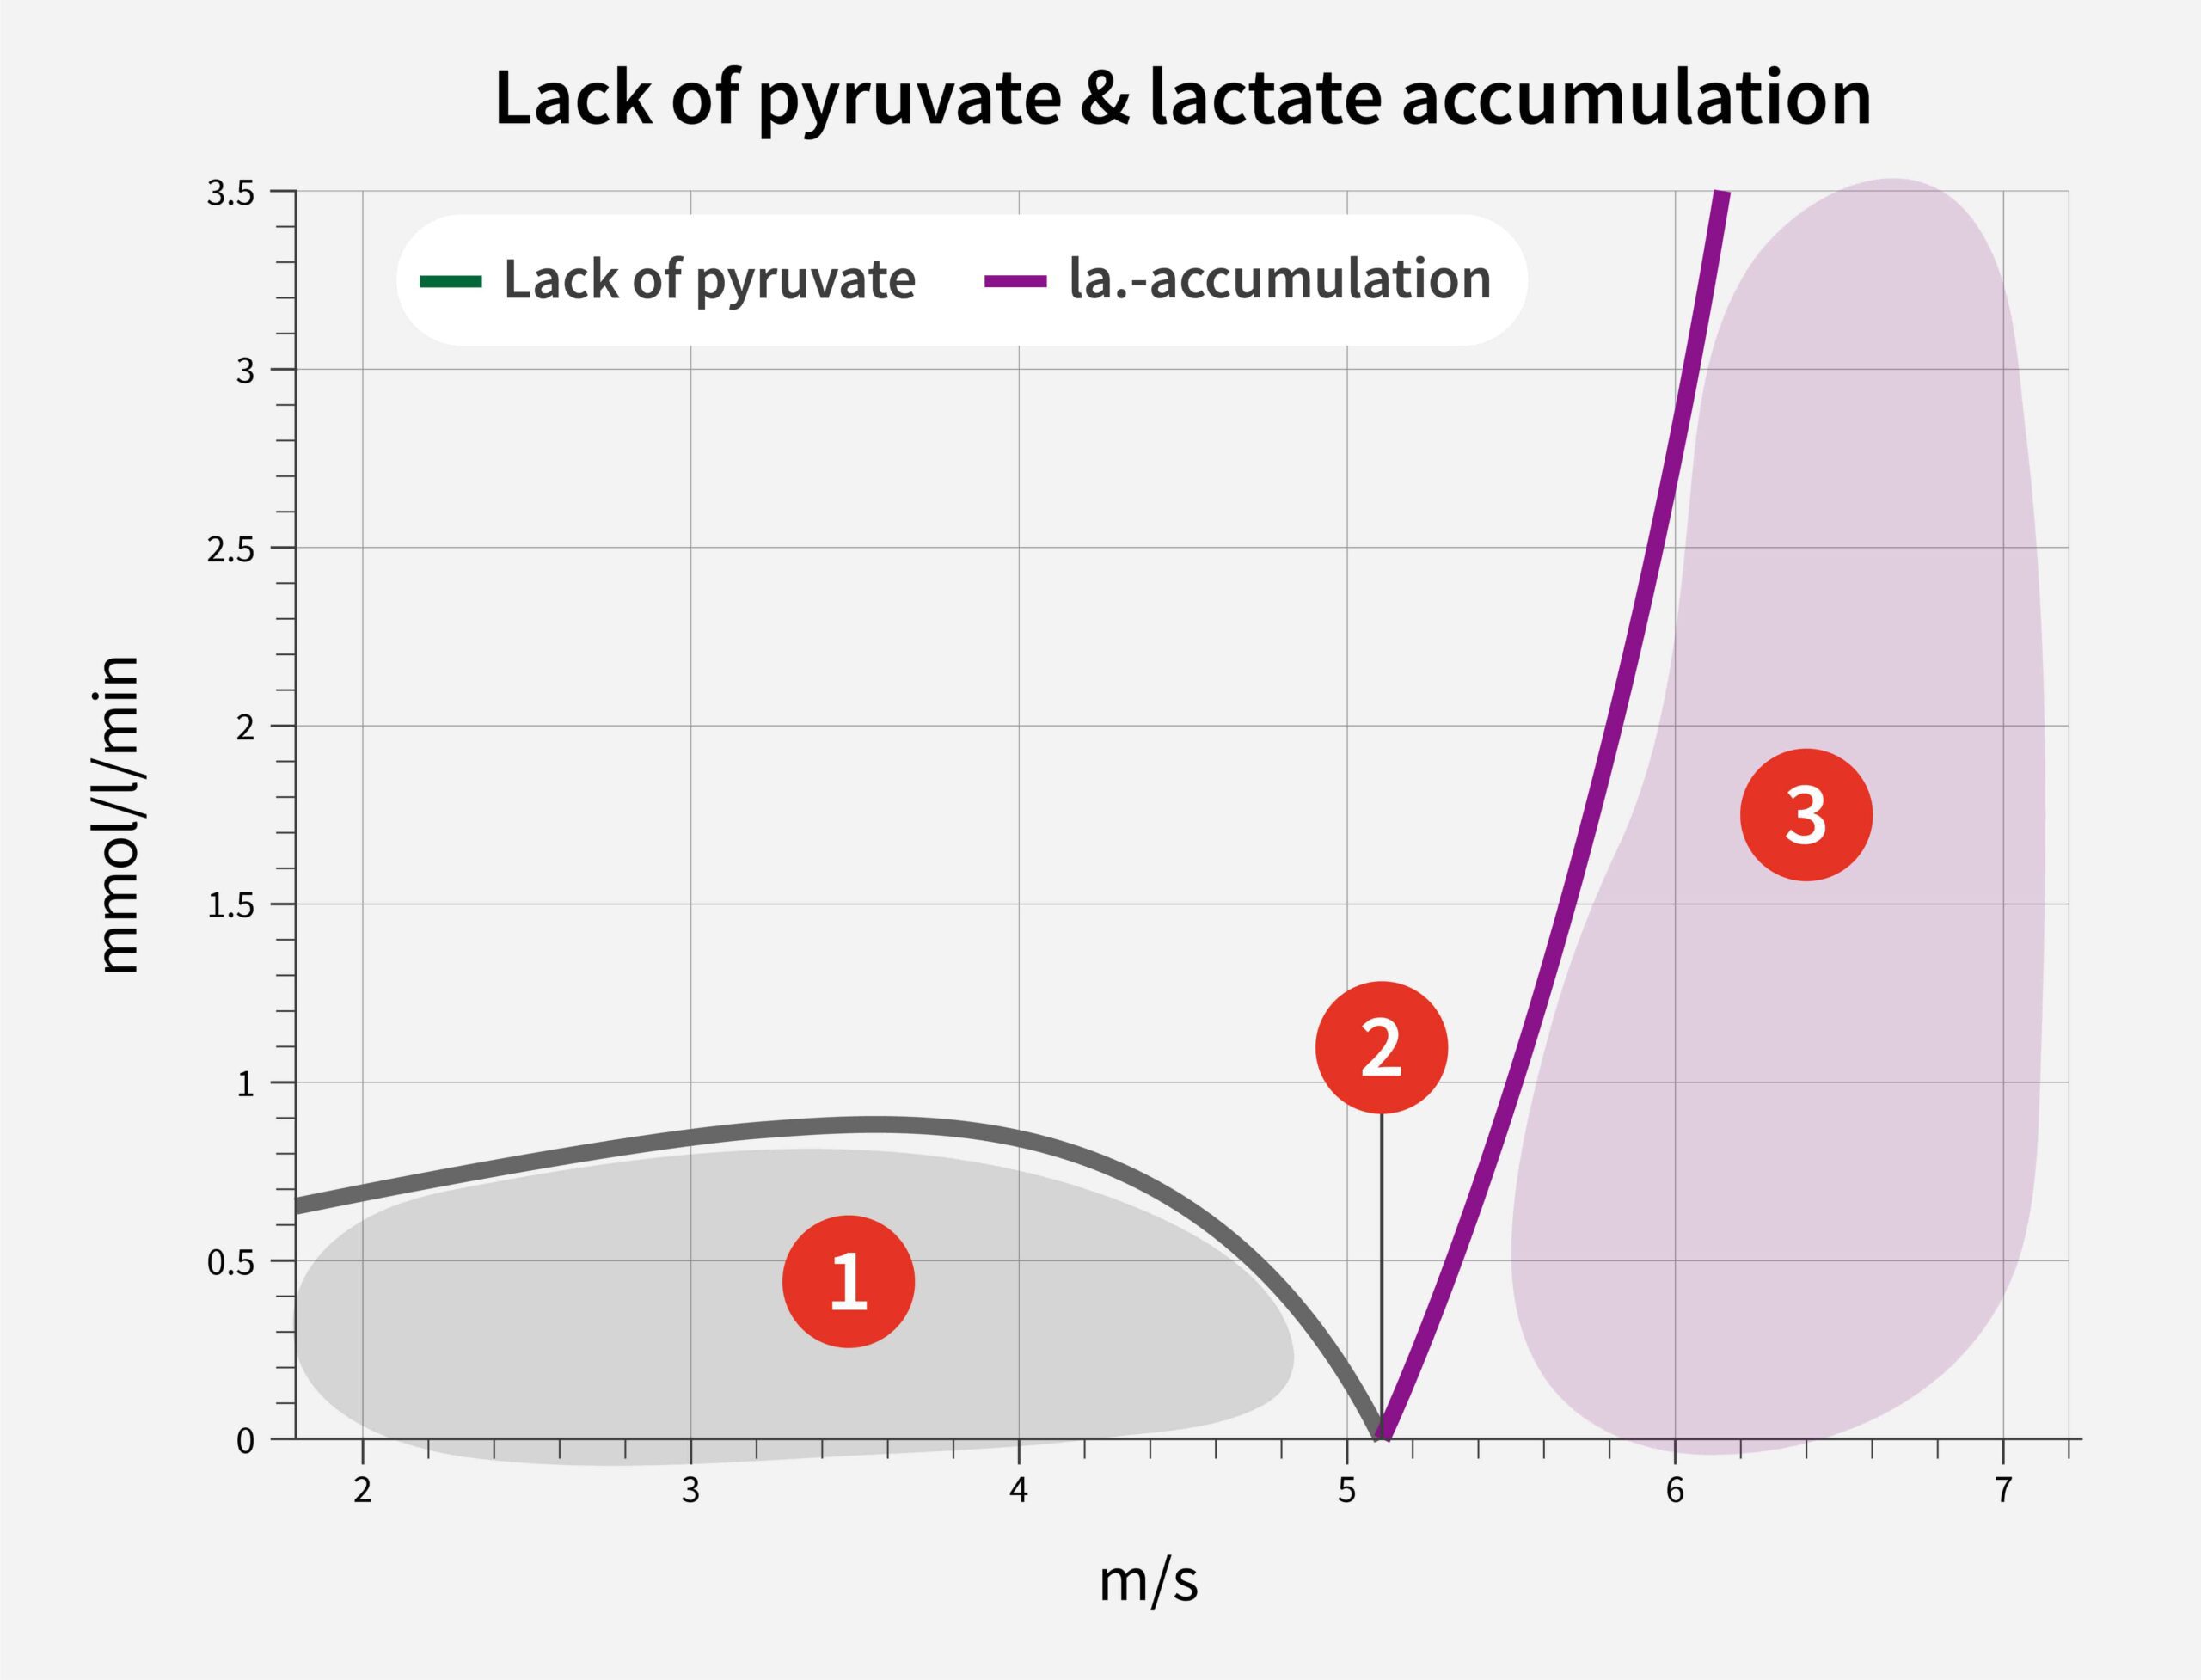
The Aerobic system burns carbohydrates and fat to produce energy. The Glycolytic system prepares the carbohydrates by using glucose and producing lactate to fuel the Aerobic system. The Glycolytic system produces energy in doing so. There are three states at which those two energy systems interact:
Image 1 represents the above-mentioned situations 1, 2 and 3. At 5.1 m/s (x axis) lactate production by the Glycolytic system equals lactate combustion by the Aerobic system. At intensities below this so-called Anaerobic Threshold or FTP, there is a lack of lactate (also called: lack of pyruvate). At intensities above 5.1 m/s, lactate will accumulate.
Let’s look at two examples that will immediately clarify how you can use the previous information to optimize your interval training!
Imagine you want to train at a race intensity that you cannot sustain yet. Take for example the athlete of image 1. If this athlete runs at 5.5 m/s (x axis), lactate accumulates 1 mmol/l/min (y axis). After say 3 minutes, the lactate accumulation is 3 min * 1 mmol/l/min = 3 mmol/l. If the athlete wants to recover, he/she needs to take into account that:
Image 1 shows that our example athlete recovers fastest from lactate accumulation at a running speed of 3.6 m/s. He/she then combusts 0.9 mmol/l lactate per minute. It will take 3 mmol/l ÷ 0.9 mmol/l/min = 3 minutes and 20 seconds before the athlete combusted all the lactate that accumulated. If he/she maintains this running speed, fat will start to deliver the lack of fuel again. Since we are recovered, we could also choose to add another interval.
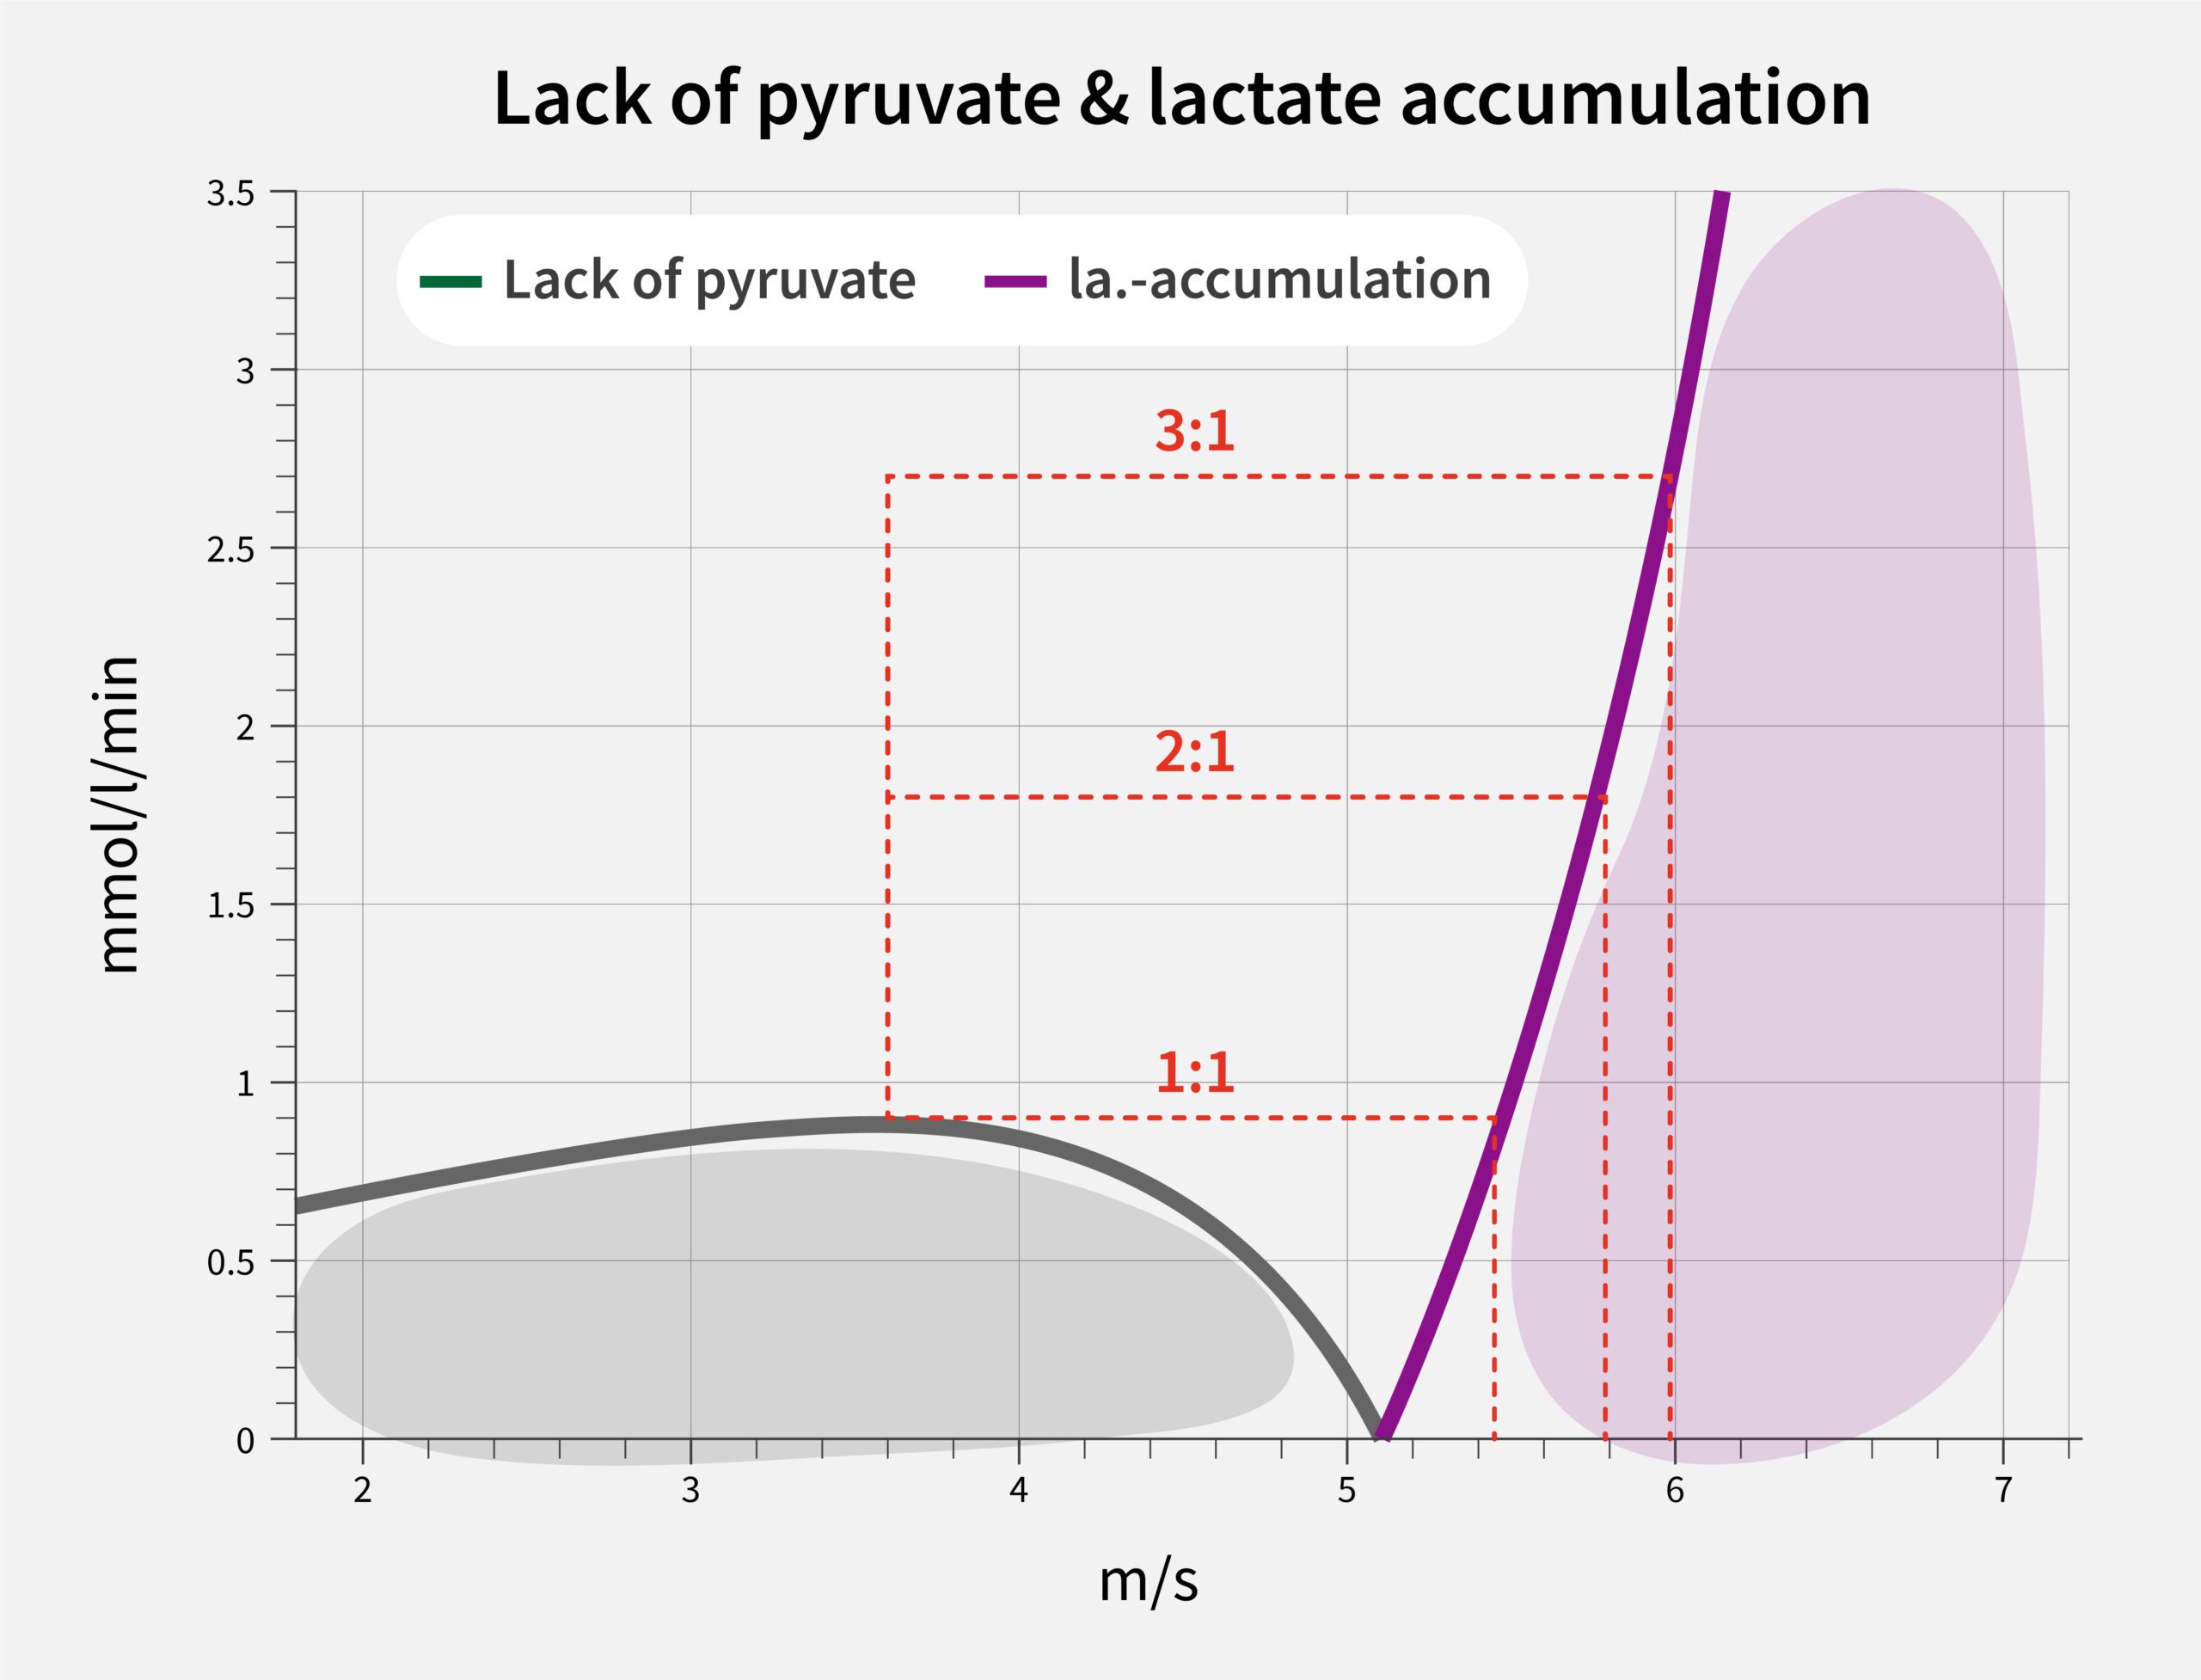
The graph also teaches us about the work-to-recovery ratio of an interval training. Obviously, the higher the intensity during an interval, the more recovery we need. The graph easily uncovers the ratio and intensities. Image 2 shows how long we should recover from any intensity. Every minute we run at ~5.5 m/s needs one minute of recovery (at ~3.6 m/s). Every minute at ~5.8 m/s needs 2 minutes of recovery, etc.
The previous two examples both represent a perfect balance between lactate accumulation and lactate combustion. In other words: lactate levels before an interval are the same as after the recovery. You could of course also choose to train at an elevated lactate level throughout the whole set of exercises. For instance, by doing a hard 2-minute effort before you start your 1 minute on/off intervals. This is only possible because you can now perfectly balance your intervals, and therefore prevent too much or too little lactate accumulation (again: a marker for fatigue).
We again see the importance of knowing the two fundamental metrics: VO2max and VLamax. As a result, you get to know your lactate accumulation and recovery, which are markers for fatigue. Using those metrics enables you to learn at which pace you recover fastest and helps you create the perfect interval workout. The next running blog is about indoor vs outdoor testing for runners: which one is better?
VO₂max, VLamax, FatMax, thresholds, fuel use and training zones, from a single test in the lab, in the field or fully remote.

